flowchart LR

d1[(Data Source 1)]
d2[(Data Source 2)]

fs1[FeatureSet 1]
fs2[FeatureSet 2]

d1 -->q1{query}--> fs1
d2 -->q2{query}--> fs2

subgraph f[For Loop]
f1[Feature 1]
f2[Feature 2]
f3[...]
fn[Feature n]
f1 & f2 & f3 & fn --> filt{{filter}}
end

fs1 -.- f
fs2 -..- filt

filt --> output
Weird Arcade Tips and Tricks
Useful Things
Memorizing FeatureSets
How I Imagined It
2 Queries
How it Actually Works
n + 1 Queries
flowchart LR

d1[(Data Source 1)]
d2[(Data Source 2)]

fs1[FeatureSet 1]

d1 -->q1{query}--> fs1

subgraph f[For Loop]
f1[Feature 1]
f2[Feature 2]
f3[...]
fn[Feature n]
f1 & f2 & f3 & fn --> filt{query}
end

fs1 -.- f

d2 -..- filt

filt --> output
The Function
function Memorize(fs) {
  var temp_dict = {
    fields: Schema(fs)['fields'],
    geometryType: '',
    features: []
  }

  for (var f in fs) {
    var attrs = {}

    for (var attr in f) {
      attrs[attr] = Iif(TypeOf(f[attr]) == 'Date', Number(f[attr]), f[attr])
    }

    Push(
      temp_dict['features'],
      {attributes: attrs}
    )
  }

  return FeatureSet(Text(temp_dict))
}Comparison
// memorize function
function Memorize(fs) {
  var temp_dict = {
    fields: Schema(fs)['fields'],
    geometryType: '',
    features: []
  }

  for (var f in fs) {
    var attrs = {}

    for (var attr in f) {
      attrs[attr] = Iif(TypeOf(f[attr]) == 'Date', Number(f[attr]), f[attr])
    }

    Push(
      temp_dict['features'],
      {attributes: attrs}
    )
  }

  return FeatureSet(Text(temp_dict))
}

// output dictionary
var out_dict = {
  fields: [
    {name: 'step', type: 'esriFieldTypeInteger'},
    {name: 'duration', type: 'esriFieldTypeInteger'},
    {name: 'method', type: 'esriFieldTypeString'}
  ],
  geometryType: '',
  features: []
}

// start step count, timer
var i = 0
var start = Now()

Push(
  out_dict['features'],
  {
    attributes: {
      step: i,
      duration: DateDiff(Now(), start),
      method: 'Traditional'
    }
  }
)

// states and counties
var states = FeatureSetByPortalItem(
  Portal('https://arcgis.com'),
  '8c2d6d7df8fa4142b0a1211c8dd66903',
  0,
  ['STATE_FIPS', 'POPULATION'],
  false
)

var counties = FeatureSetByPortalItem(
  Portal('https://arcgis.com'),
  '3c164274a80748dda926a046525da610',
  0,
  ['NAME', 'STATE_FIPS', 'POPULATION'],
  false
)

// loop through counties
for (var c in counties) {
  // get parent state feature
  var the_state = First(Filter(states, `STATE_FIPS = '${c['STATE_FIPS']}'`))

  Push(
    out_dict['features'],
    {
      attributes: {
        step: i,
        duration: DateDiff(Now(), start),
        method: 'Traditional'
      }
    }
  )

  i ++
}

// reset counter for memorized version
// start step count, timer
i = 0
start = Now()

Push(
  out_dict['features'],
  {
    attributes: {
      step: i,
      duration: DateDiff(Now(), start),
      method: 'Memorized'
    }
  }
)

// states and counties
var memstates = Memorize(FeatureSetByPortalItem(
  Portal('https://arcgis.com'),
  '8c2d6d7df8fa4142b0a1211c8dd66903',
  0,
  ['STATE_FIPS', 'POPULATION'],
  false
))

var memcounties = Memorize(FeatureSetByPortalItem(
  Portal('https://arcgis.com'),
  '3c164274a80748dda926a046525da610',
  0,
  ['NAME', 'STATE_FIPS', 'POPULATION'],
  false
))

// loop through counties
for (var c in memcounties) {
  // get parent state feature
  var the_state = First(Filter(memstates, `STATE_FIPS = '${c['STATE_FIPS']}'`))

  Push(
    out_dict['features'],
    {
      attributes: {
        step: i,
        duration: DateDiff(Now(), start),
        method: 'Memorized'
      }
    }
  )

  i ++
}


return FeatureSet(Text(out_dict))Histograms!
Yeah, Dashboards have bar charts.
But do they have binning?
The Process
- Calculate min and max
- Determine size of each bin
- For each bin:
- Filter data in bin range
- Count number of records
- Create a feature with bin number, count
The Function
function Histogram(fset, field, bins) {
  var hmin = Min(fset, field)
  var hmax = Max(fset, field)
  var step = Floor((hmax - hmin) / (bins - 1))

  var hist_fs = {
    fields: [
      {name: 'bin_num', type: 'esriFieldTypeInteger'},
      {name: 'bin_name', type: 'esriFieldTypeString'},
      {name: 'the_count', type: 'esriFieldTypeInteger'}
    ],
    geometryType: '',
    features: [{
      attributes: {
        bin_num: 0,
        bin_name: `< ${Floor(hmin + step)}`,
        the_count: Count(Filter(fset, `${field} < ${hmin + step}`))
      }
    }]
  }

  var b_idx = 1

  for (var i = hmin + step; i < (hmax - step); i += step) {
    var the_count = Count(Filter(fset, `${field} > ${i} AND ${field} < ${i + step}`));
      Push(
          hist_fs['features'],
          { attributes: {
              bin_num: b_idx,
              bin_name: `${Floor(i)} — ${Floor(i + (step - 1))}`,
              the_count: the_count
          }}
      )

      b_idx += 1
  }

  Push(hist_fs['features'],
  { attributes: {
      bin_num: b_idx,
      bin_name: `> ${Floor(i)}`,
      the_count: Count(Filter(fset, `${field} > ${i}`))
    }
  })

  return FeatureSet(Text(hist_fs))
}
Dynamic Binning?
What if the bin number could change?
What if it could be dynamic? Is that even possible?
Sort of!
All the Bins
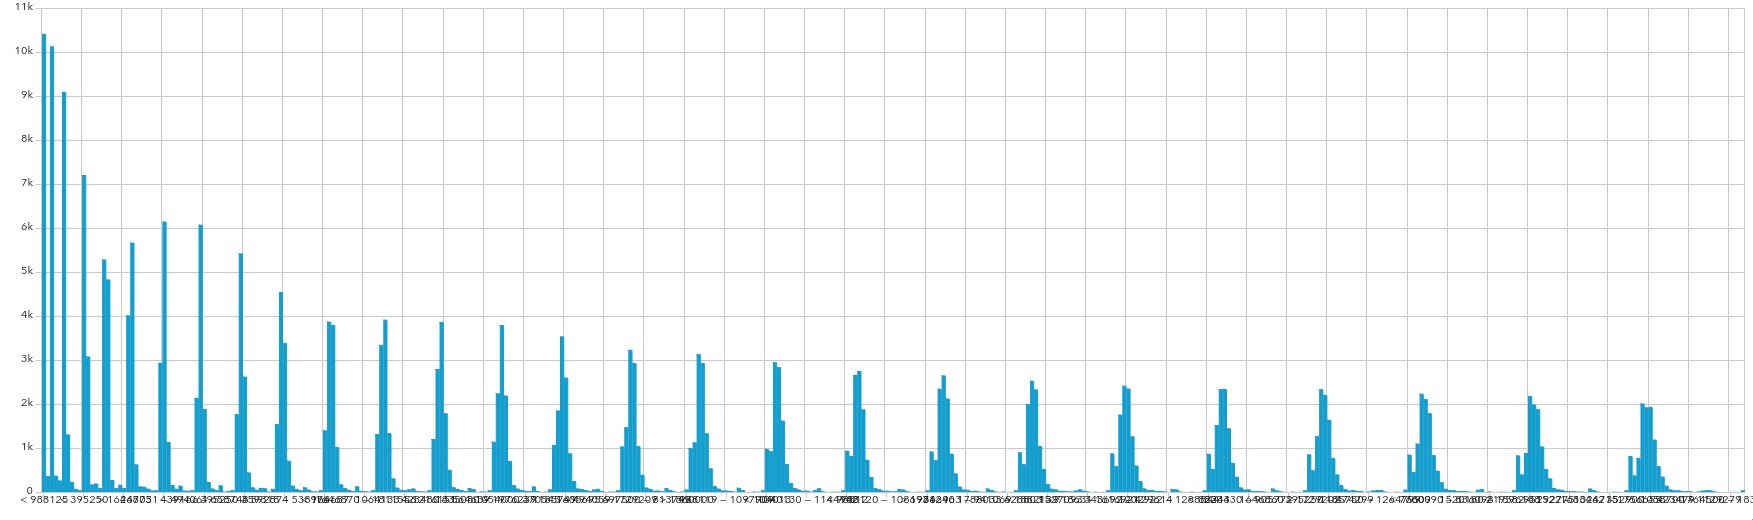
Table Widgets
Colors and Hex Codes
Messing with numbers is easier than with hex codes
Arcade function ToHex() is a one-way street
hexed
Given an array of RGB values, this function returns the appropriate hex code:
hexed([255,150,56]) → "#ff9638"
Striping
Row striping is built in.
But not when you enable Advanced Formatting!
darken
With numeric color arrays, darkening a color is as simple as:
Put it together: striper
Tables ♥ HTML
SVG Icons
Aren’t there built-in icons?
- Only aligns left or right
- Fixed size
- Awkward to add, name
Literal SVG Code
Remember to set height and fill!
var alert_svg = Decode(
  $datapoint.alert,
  'GREEN', `<svg height=40px viewBox="0 0 24 24"><title>alert-circle</title><path fill="green" d="M13,13H11V7H13M13,17H11V15H13M12,2A10,10 0 0,0 2,12A10,10 0 0,0 12,22A10,10 0 0,0 22,12A10,10 0 0,0 12,2Z" /></svg>`,
  'YELLOW', `<svg height=40px viewBox="0 0 24 24"><title>alert-rhombus</title><path fill="gold" d="M12 2C11.5 2 11 2.19 10.59 2.59L2.59 10.59C1.8 11.37 1.8 12.63 2.59 13.41L10.59 21.41C11.37 22.2 12.63 22.2 13.41 21.41L21.41 13.41C22.2 12.63 22.2 11.37 21.41 10.59L13.41 2.59C13 2.19 12.5 2 12 2M11 7H13V13H11V7M11 15H13V17H11V15Z" /></svg>`,
  'ORANGE', `<svg height=40px viewBox="0 0 24 24"><title>alert</title><path fill="orange" d="M13 14H11V9H13M13 18H11V16H13M1 21H23L12 2L1 21Z" /></svg>`,
  'RED', `<svg height=40px viewBox="0 0 24 24"><title>alert-decagram</title><path fill=red" d="M23,12L20.56,9.22L20.9,5.54L17.29,4.72L15.4,1.54L12,3L8.6,1.54L6.71,4.72L3.1,5.53L3.44,9.21L1,12L3.44,14.78L3.1,18.47L6.71,19.29L8.6,22.47L12,21L15.4,22.46L17.29,19.28L20.9,18.46L20.56,14.78L23,12M13,17H11V15H13V17M13,13H11V7H13V13Z" /></svg>`,
  ''
)

return {
  cells: {
    alert: {
      displayText: alert_svg,
      textAlign: 'center'
    }
  }
}
HTML “Chart” with Inline Style
- Make a
<div>and usestyle="…" - Hard-code the “max” value
Dynamic Buttons
var btn_style = `padding:5px; background-color:#333; font-weight:bold; color:white; line-height:30px; border-radius:7px; text-align:center;`

var action_button = Decode(
  $datapoint.alert,
  'RED', `<a style="${btn_style}" href="tel:1234567890">That's serious! Call Someone!</a>`,
  'ORANGE', `<a style="${btn_style}" href="mailto:someone@email.com">Important. Send an e-mail</a>`,
  'YELLOW', '',
  'GREEN', `<a style="${btn_style}" href="https://arcgis.com">Click to Close</a>`,
  ''
)
Long Strings, Multiple Lines
Long text in a list → variable height!
Long text in a table → truncated text or horizontal scrolling!
function Breakup(str, limit) {
  if (IsEmpty(limit)) { return 'Error! Specify a limit or you will crash your browser' }
  var out_arr = []
  var search_str = str

  While(Count(search_str) > limit){
    var nearest_break = Find(' ', search_str, limit - 6)
    Push(out_arr, Left(search_str, nearest_break))
    search_str = Trim(Right(search_str, Count(search_str) - (nearest_break)))
  }

  Push(out_arr, search_str)

  return Concatenate(out_arr, '<br>')
}Going the Other Way
Goofy Stuff
Notes Table as Chat Convo
var prtl = Portal('https://maps.co.kendall.il.us/portal')

var fs = FeatureSetByPortalItem(
  prtl,
  'da490f45ce954edca8ba4a5cd156564b',
  1,
  ['remarks', 'doc_guid', 'created_user', 'created_date']
)

var out_dict = {
  fields: Splice(Schema(fs)['fields'], [{name:'is_you', type:'esriFieldTypeString'}]),
  geometryType: '',
  features: []
}

for (var f in fs){
  Push(
    out_dict['features'],
    {
      attributes: {
        remarks: f['remarks'],
        doc_guid: f['doc_guid'],
        created_user: f['created_user'],
        created_date: f['created_date'],
        is_you: Iif(f['created_user'] == GetUser()['username'], 'yes', 'no')
      }
    }
  )
}

return FeatureSet(out_dict)Aggregate by Month, Split by Category
Packing and Unpacking JSON
var prtl = Portal('https://maps.co.kendall.il.us/portal')

function Memorize(fs) {
  var temp_dict = {
    fields: Schema(fs)['fields'],
    geometryType: '',
    features: []
  }

  for (var f in fs) {
    var attrs = {}

    for (var attr in f) {
      attrs[attr] = Iif(TypeOf(f[attr]) == 'Date', Number(f[attr]), f[attr])
    }

    Push(
      temp_dict['features'],
      {attributes: attrs}
    )
  }

  return FeatureSet(Text(temp_dict))
}

var fs = Memorize(Filter(FeatureSetByPortalItem(
  prtl,
  'da490f45ce954edca8ba4a5cd156564b',
  1,
  ['remarks', 'objectid', 'created_user', 'created_date']
), "created_date is not null and created_user <> 'kendall_gis'"))

var out_dict = {
  fields: [
    {name: 'theYear', type: 'esriFieldTypeInteger'},
    {name: 'theMonth', type: 'esriFieldTypeInteger'},
    {name: 'contents', type: 'esriFieldTypeString'}
  ],
  geometryType: '',
  features: []
}

// get distinct year/month combos

var dated = GroupBy(
  fs,
  ['objectid', 'remarks', 'created_user'],
  [
    {name: 'theYear', expression: 'extract(year from created_date)', statistic: 'sum'},
    {name: 'theMonth', expression: 'extract(month from created_date)', statistic: 'sum'}
  ]
)

var month_set = Distinct(dated, ['theYear', 'theMonth'])

for (var m in month_set) {
  var month_remarks = Filter(dated, `theYear = ${m['theYear']} and theMonth = ${m['theMonth']}`)

  var remark_json = {}

  for (var mr in month_remarks) {
    if (HasKey(remark_json, mr['created_user'])) {
      remark_json[mr['created_user']] += `;${mr['remarks']}`
    } else {
      remark_json[mr['created_user']] = mr['remarks']
    }
  }

  Push(
    out_dict['features'],
    { attributes: {
      theYear: m['theYear'],
      theMonth: m['theMonth'],
      contents: Text(remark_json)
    }}
  )
}

return FeatureSet(out_dict)List Item Template
var output = `<div style="display:flex">
<div style="width:15px; margin:5px; writing-mode:vertical-rl; font-size:larger; font-weight:bold;">
${mname}<br>
${$datapoint.theYear}
</div>`

for (var r in remarks) {

  var remarks_list = `<ul><li>${Concatenate(Split(remarks[r], ';'), '</li><li>')}</li></ul>`

  var the_div = `<div style="padding:3px; margin:3px; border-radius:5px; width:75%;">
  <h4 style="text-decoration:underline">${r}</h4>${remarks_list}
  </div>`

  output += the_div
}SVG Clock
Still one of my favorite useless things.
Line Item Template
<p style="text-align:center;">
    <svg height="300" width="300">
      <circle cx="150" cy="150" fill="white" r="130" stroke="black" stroke-width="5"></circle>
      <path d="M150 150 L 150 40 Z" stroke="black" stroke-linecap="square" stroke-width="3" text-align:center="" transform="rotate({expression/minutedegrees},150,150)"></path>
      <path d="M150 150 L 150 60 Z" stroke="black" stroke-linecap="square" stroke-width="5" transform="rotate({expression/hourdegrees},150,150)"></path>
    </svg>
</p>In Closing: General Tips
Backtick Strings (Template Literals)
Backticks and Mixed Types
Backticks and Line Breaks
Use SQL Functions
GroupBy and Distinct
- Pass SQL commands to server
- Let the server do all the work
- Returns a FeatureSet for you, no cobbling together a dictionary
- Use the ObjectID to get the same features but with new fields
Consider Data Expressions
- Faster than standard layers when done right
- Limit incoming fields
- Omit geometry if not needed
- Flexible output
Use the Console Command
- Pass things to
Console('some message') - Great for debugging an expression
- Messages get sent to your browser console, too!
Whitespace is Free
Use line breaks and spaces
No bonus points for conserving code lines
No trophies for Maximum Terseness, sorry
Comment!
You may not be the only person to look at your code.
You may forget why you wrote it that way two years ago.
Leave comments
Questions?