Cleaning up Boundary Relations in JOSM
Boundaries: What’s the Point?
Boundary relations in OSM are often overlooked or outright avoided. But should they get more attention? I think so!
True, they’re not nearly as sexy as building footprints and highways. And maybe not as directly useful to data consumers? But! Having clean and up-to-date boundaries in OSM:
- lends more credibility to the project overall
- improves the results from Nominatim and other locators
- makes future editing nicer, with a clearer history
Barriers to Mapping
Complexity
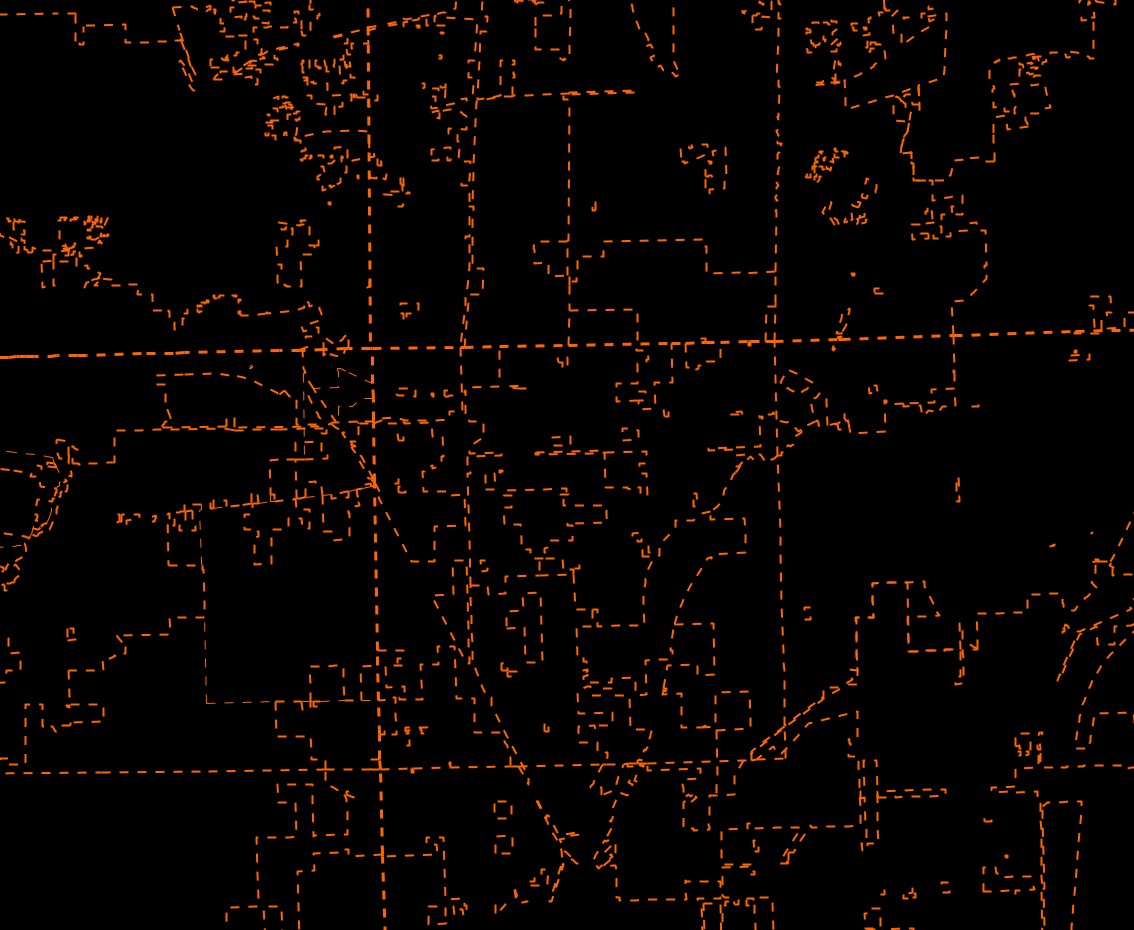
It makes me weary just looking at this pile of spaghetti. Here in Chicagoland, our admin_level=8 boundaries are really wonky. You go to clean up one city, and you end up touching a dozen of other city and county boundaries in the process.
I am not pretending that these features are actually simple. There is certainly a level of complexity here coming from the size and shape of the features.
But as I’ll endeavor to show, managing boundaries follows a handful of clear rules.
Verifiability
Pick most any boundary, go to that spot in the real world. What’s there? Maybe a “welcome to…” sign somewhere nearby? Maybe a survey marker?
Likely: nothing! Boundaries are a treat for the armchair mapper, in that you’ll probably do far better from a home computer than in the field.
Verifiability for benches: field trip!
Verifiability for boundaries: research project!
I would say that boundaries are verifiable, in the sense that the information to confirm the features is readily available from one source or another. We’ll get into that more in a bit, too.
Understanding Boundary Relations
Oversimplification
Boundaries are basically just multipolygons.
- Series of member ways
- Ways have role of
innerorouter - Ways must collectively form closed loops of a shape
Boundaries are like routes?
Boundaries are also a bit like route relations, if that’s a useful comparison for you. A route is comprised of individual ways (roads, for instance). A single road might belong to multiple routes, but it’s still just a single way.
When boundaries are colocated, we merge the overlapping segments into a single way that participates in both relations.
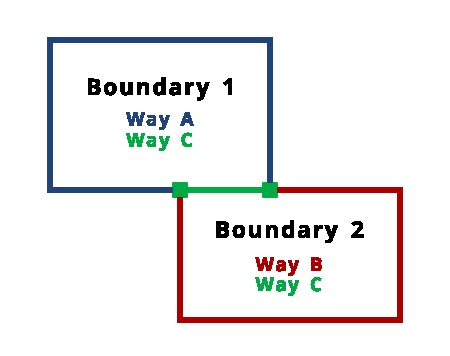
Boundaries are not like routes!
The “building blocks” of boundaries aren’t really things the way a route is made of of highway segments. Remove the boundary relation, and the member ways have no meaningful information.
Boundaries are like a weird cult
Not only do they share readily with all of their neighbors, boundaries do not associate with non-boundary features!
Editors may accidentally (or even intentionally) glue non-boundary features onto a boundary way. Lots of boundary ways follow other features, like rivers and roads. This is specifically called out in the wiki.
Would I unglue the Illinois state line from the Mississippi River? Maybe, but I’d also be willing to let that one slide.
But landuse? Natural features? Highways? Unglue!
Setting up JOSM
Get some Sample Data
- Open your preferences
- Check the box to turn on Expert Mode down in the lower-left
- Open the download data window
- Notice the fancy new tab you have available: Download from Overpass API
- Enter the following query:
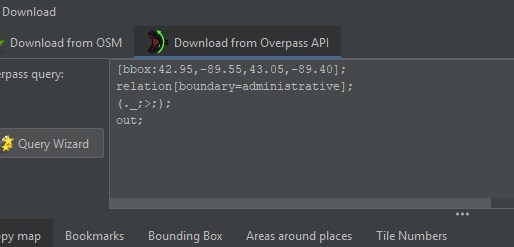
When you download with the Overpass API, your data may be incomplete, which is referred to as “sparse editing”. In our case, we actually want the data incomplete, because downloading everything for a bounding box the size of a medium city would be a lot, and most of it not necessary for our work.
When you’re sparse editing, incomplete data can lead to trouble. What looks like a disconnected feature may in fact share nodes / ways with something your query didn’t download. JOSM will do its best to warn you about this kind of thing, but unless you’re very careful, there’s a good chance you could end up editing other features by accident.
Changing tags, that’s fine. Changing geometry? Proceed with caution!
Custom MapCSS
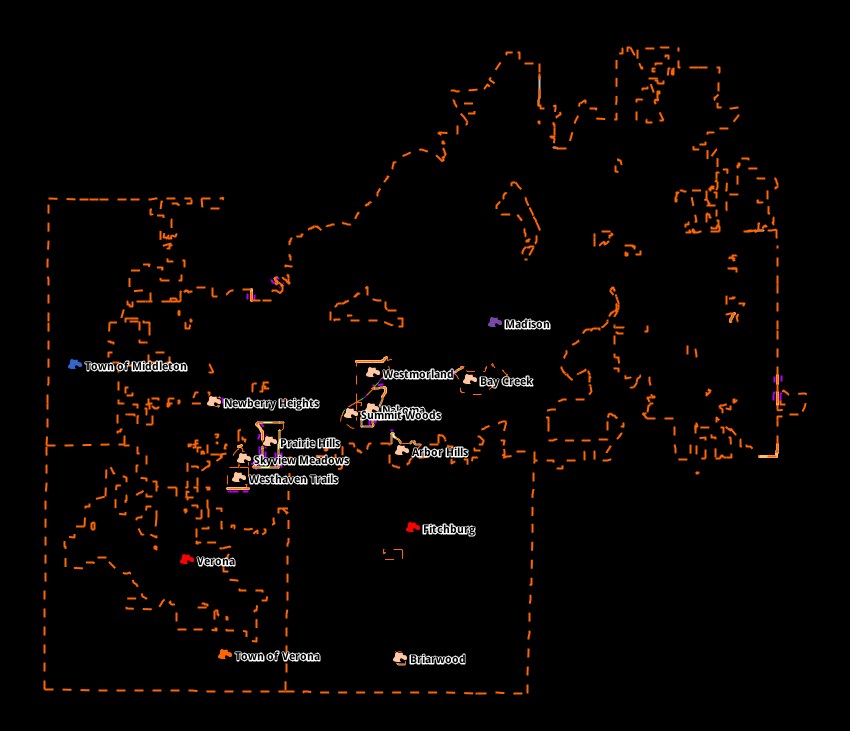
Our query grabbed boundary features roughly around the Fitchburg, WI area. Your JOSM probably looks like this:
The default styles are not helping us here. One of my favorite things about JOSM is the ability to define and load custom map styles. A good style can facilitate specific mapping projects and help you focus on what matters.
For this workshop, I made a custom style that you should use! You can use it directly from the Codeberg repo, or you can save the file locally. Personally, I prefer a local file when it’s my own, specific project. But if it’s a broader effort with other users involved, a remote URL will periodically refresh with changes from the source, and that can be nice to keep everyone on track.
Open up your preferences, and go to the Map Paint Styles tab. On the far right, click the plus icon to add a new style.
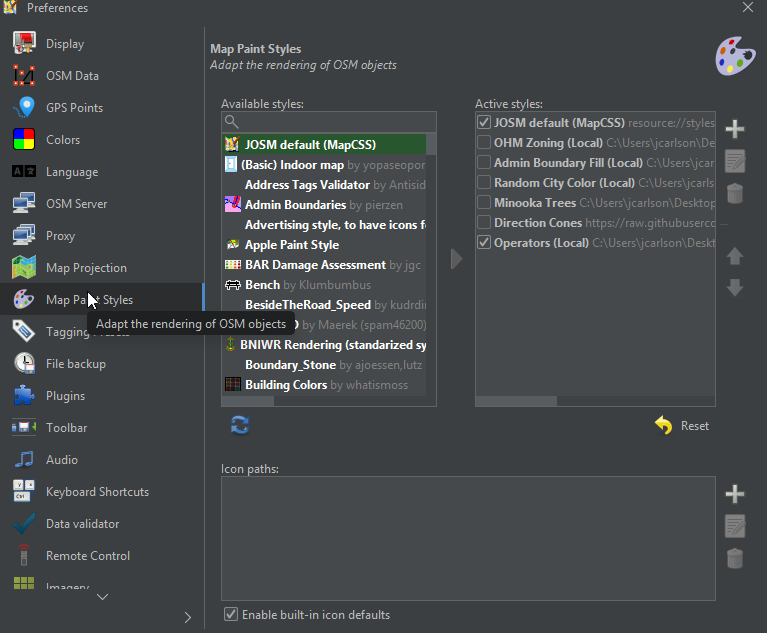
Name the new style whatever you like, browse to find the file, and proceed! Go ahead and turn off any other styles so that we only see what this new style is defining.
Now your JOSM looks like this:
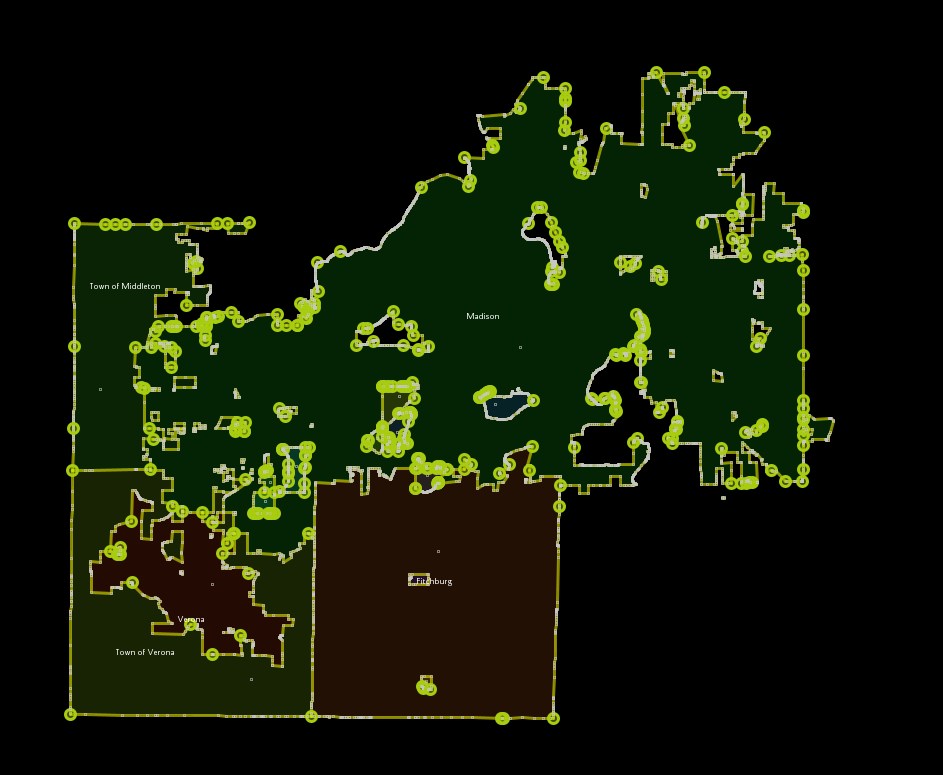
How is this better? Let me explain.
Style Elements
Boundary vs Not-Boundary
We care about the boundaries, and we need to see what isn’t a boundary. But beyond that, we really don’t care what the other things are. The style applies a default pinkish stroke and fill to “not-boundary”, and thick yellow lines for boundary features.
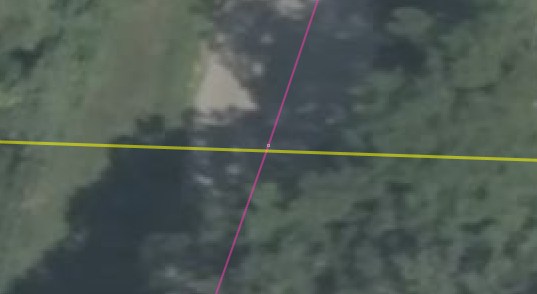
If I throw some fake data into the map, say a road and a house, you can see the difference:
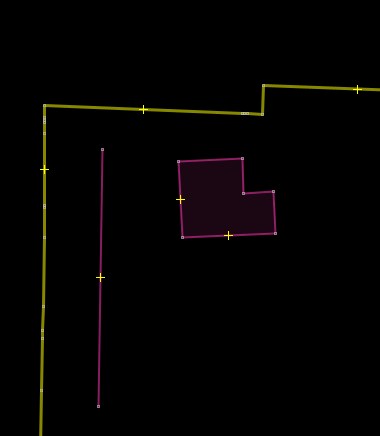
Shared Nodes
For our cleanup work, one of the most important things to see are glued nodes, or as MapCSS refers to them, connection nodes. These are nodes shared between at least two different ways.
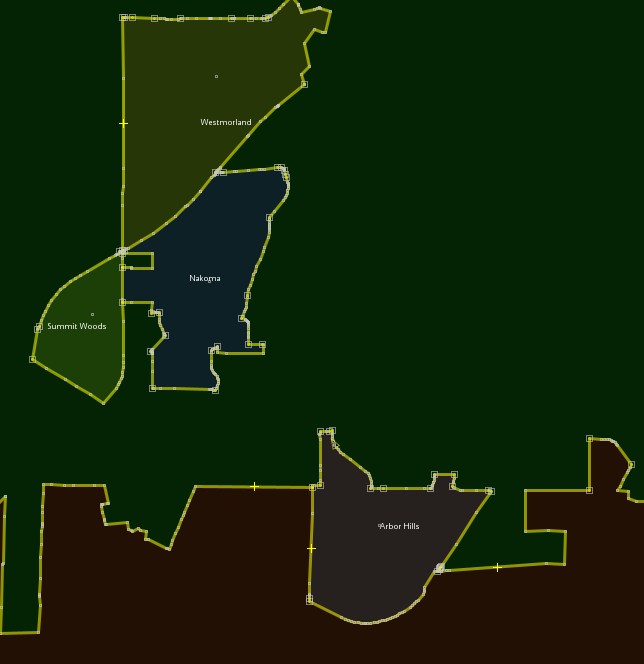
Boundary Fill
For complex boundaries, it’s nice to quickly tell between what’s inside and outside.
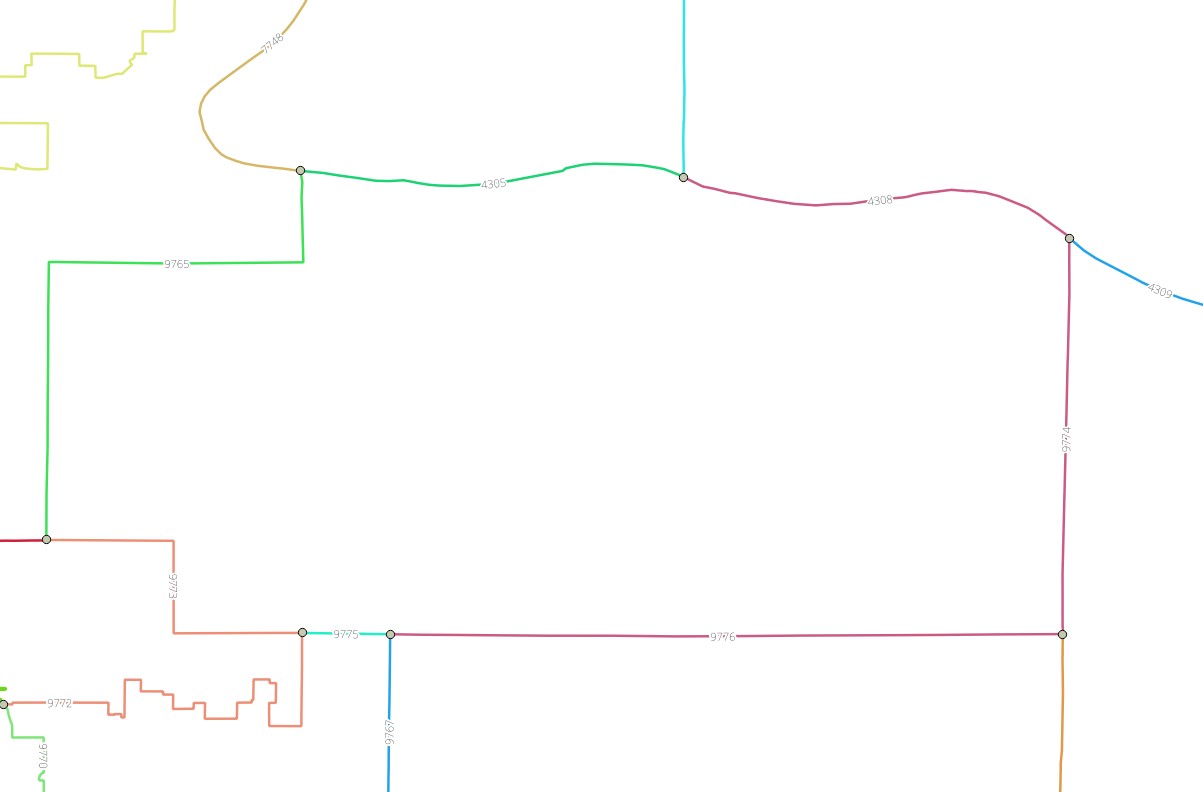
City Colors
When you’re working somewhere with lots of overlapping or adjacent boundaries, it’s also nice to know which is which! The style will alter the color of the area fill based on the name tag.
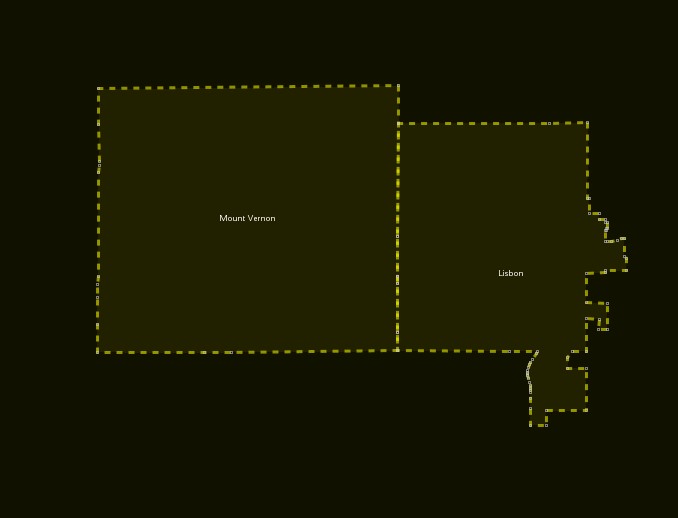
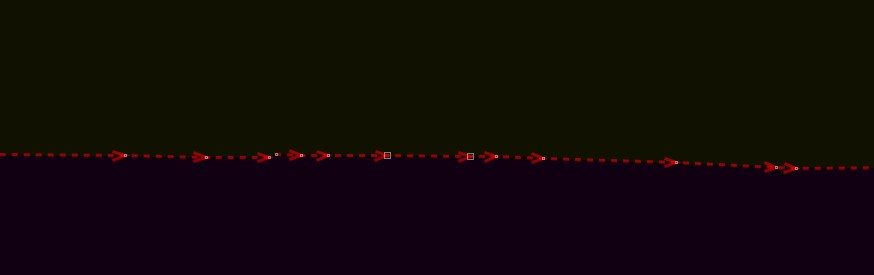
Dashed Lines
Boundary ways should never overlap, but it might be hard to see when they do. If the lines are dashed, the dashes probably won’t line up between the different ways, giving you a clear visual indicator of the problem.
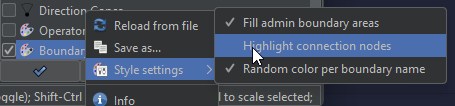
Settings!
Maybe you like some of those features, but not all? If you look at the file, you’ll find that they’re tied to settings. Right-click the style, and you’ll see checkboxes for each of the above features. Toggle them as you like!
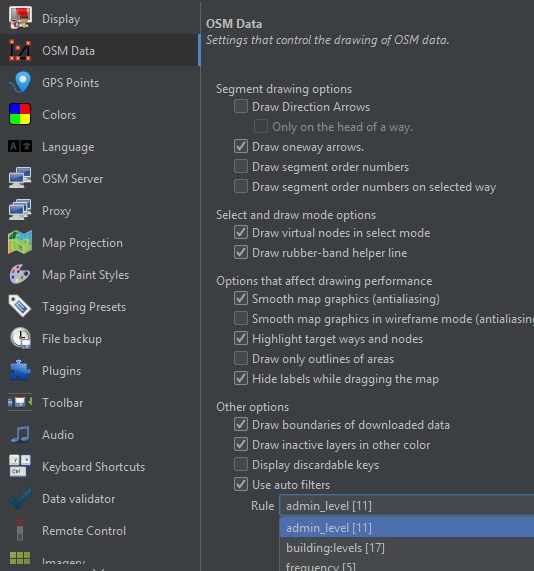
Auto-Filter
In the OSM Data tab of your preferences, there is a setting down at the bottom for an auto-filter. One of the options available to you is admin_level.
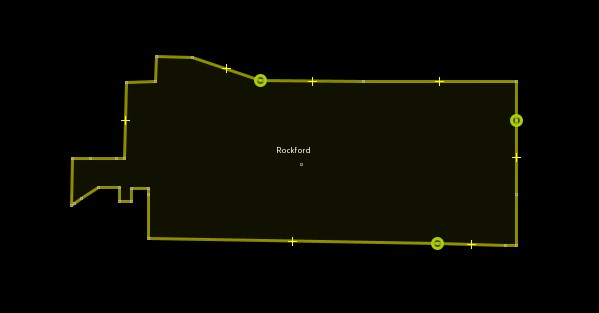
With that selected, you’ll see these little teal buttons in the upper-left:
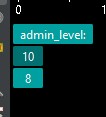
Clicking one of those numbers will filter the map data to show only features with that particular admin level on it.
Generally, we don’t actually want to have filters on when we edit things, as member ways can and do participate in a variety of different admin levels. But it can still be useful as you’re inspecting the data and trying to understand it.
Cleaning Up
Okay, we’ve done enough explaining and setting up. It’s time to actually do something. Let’s clean some boundaries!
Glued Nodes
One of the most common issues you’ll find with admin boundaries is that some of the member ways are glued to non-admin features, especially roads and landuse. Fixing these is not hard, but we’ll want a way to quickly identify them without looking at every segment of the boundary.
Finding the Nodes: An Overpass Query
Overpass is powerful if you write the query correctly.
- 1
-
Download any administrative boundaries, store them as
.r - 2
-
Find all the member ways that belong to the relations in
.r, store those as.w - 3
-
Find every node belonging to the ways in
.w, store as.n - 4
-
Recurse up, finding every way that includes a node from
.n. Combine those ways with the relations in.r - 5
- Return the result
Go ahead and run that query for a spot on the map. Pick a small, rural town, maybe in another state, so that you don’t overlap with someone else’s work. I am pretty confident in what this query does, but you should not edit outside of your original bounding box. There’s a limit to how much the query is going to recurse up and down attached features. If you go beyond that initial box, there’s a real chance of editing other things by mistake.
We’re here to fix the boundary relations, not introduce new errors!
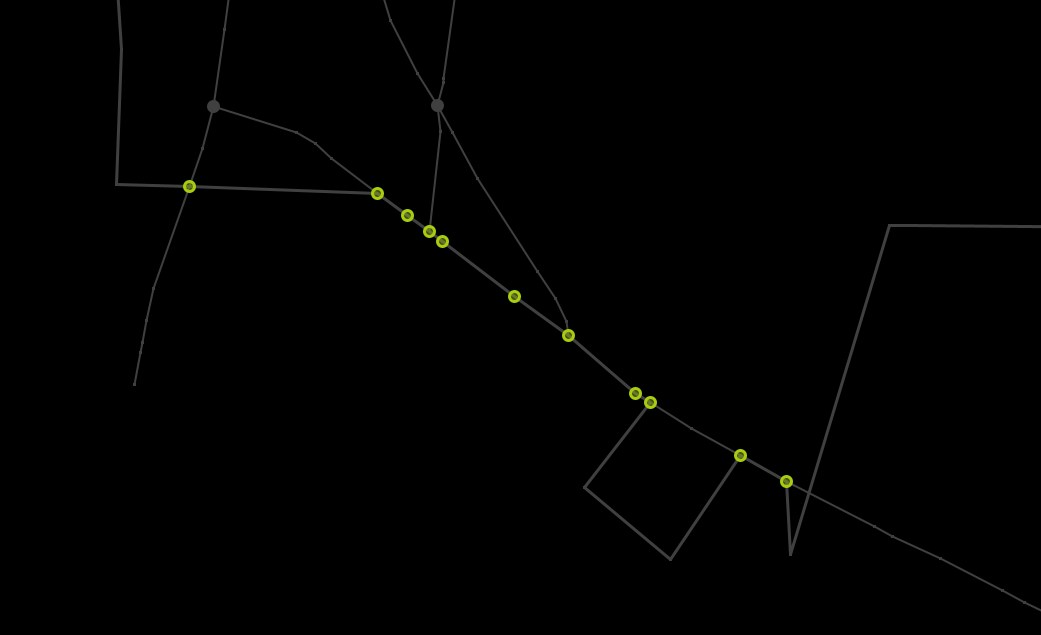
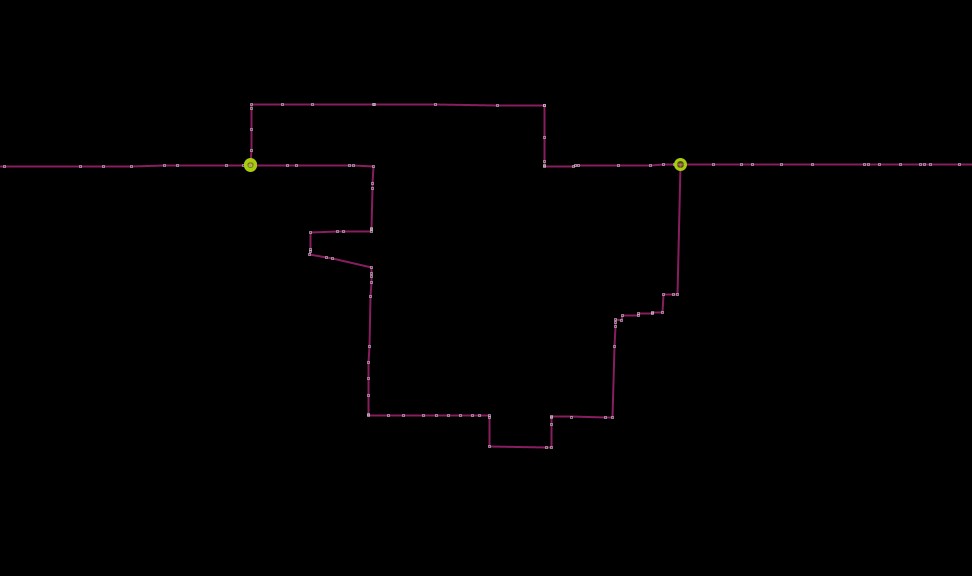
So, drag your bounding box well around the administrative feature you want to work with. For an example, here’s Gratiot, WI:
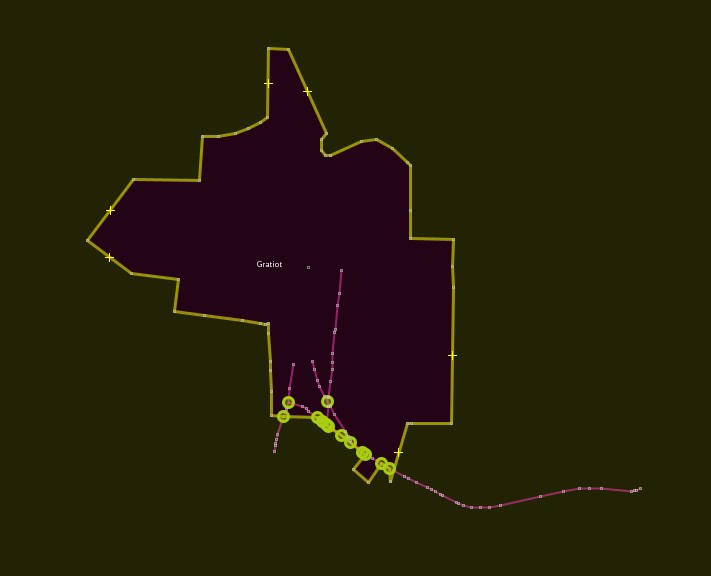
Right away, we can see some pink “not-boundary” features were included. Let’s fix that! There are two approaches I take to these things.
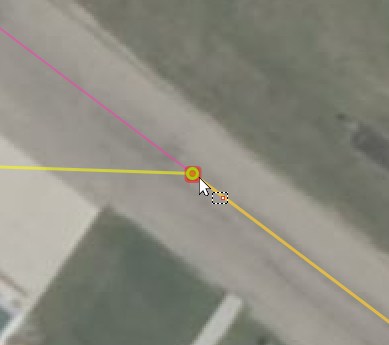
Unglue and Move
This is for when the boundary actually needs the node it’s glued to to maintain its shape. And sometimes the other feature needs that node, too. They just don’t need to share it.
Fixing these is easy!
- Select a glued node
- Press GG
- Move the boundary node off to a slightly different position
You could just press G and leave it at that, but two nodes at the exact same position will get flagged under Mixed type duplicated nodes.
Doing it this way leaves the boundary basically the same as we found it, but now independent of non-boundary features. Success!
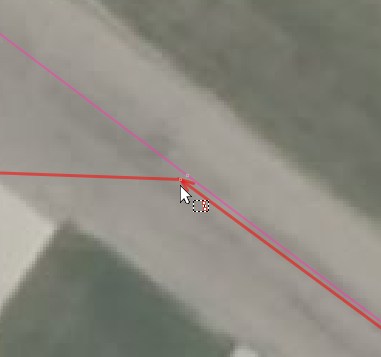
Disconnect Node
Sometimes a node is added to a boundary when something else intersects with it. The node is not really defining the shape in a meaningful way.
Fixing these is even easier!
- Select the boundary way
- Select the glued node
- Press Alt+JAlt+J
The offending node has been removed from the boundary way! Nothing else has changed! Success!
You might see the boundary way is slightly off from the node. That’s expected, and probably fine! But if disconnecting the node made a pretty big gap, you might want to undo and use the “unglue and move” method instead.
Seeing Glued Nodes
In addition to that query we started with, a well-written filter in JOSM can be even more help in our work. Consider this filter expression:
In plain language, this is looking for nodes of relation members that are also nodes of non-relation members, or nodes that have been newly created.
Check it out! You could very easily select all of these and unglue or disconnect. I like going one at a time, but sometimes you have a boundary that’s glued to every single node of a straight rural road. Making it easier to edit big chunks in one go is very handy!
I really wanted my MapCSS to highlight these nodes separately from generic connections, but couldn’t get it quite right. If you’re better with MapCSS than me, I would love some insight on how to do this!
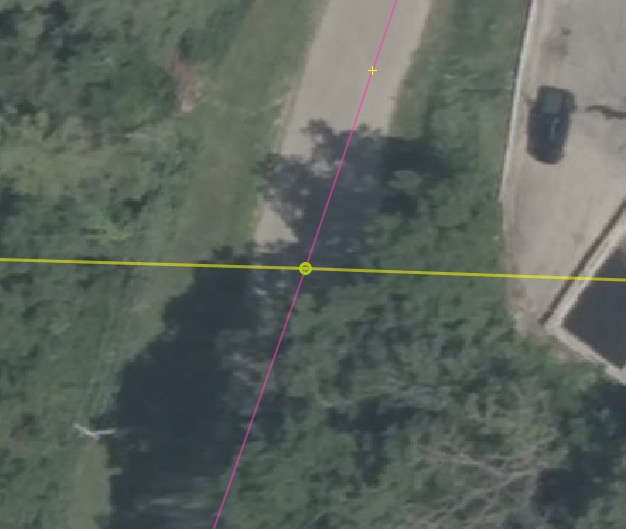
False Endpoints
Here’s something else you see quite often in OSM boundary relations: multiple ways that meed end-to-end, with no other boundaries participating at the shared node.
I believe it’s an artifact from the initial boundary import? In any case, we should tidy this up. In general:
When an unclosed boundary way ends, there should be at least two other ways connected at the node.
If you have two consecutive ways that only belong to the same relations, there’s no reason to keep them separate. Select them both and press CC to combine them.
Now you’re representing the same boundaries, but with fewer features overall! Success!
Bigger Edits
So far, we’ve really only tidied the relations, making simple and separate from other things, but not really adjusting any geometry. What about some real edits? Adding, deleting, and making big moves. Let’s go!
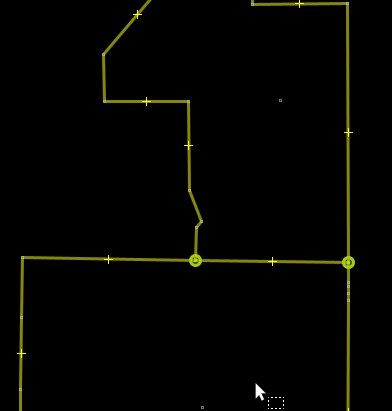
Simplify!
Okay, this isn’t that big of an edit, but it’s still deleting data, so we saved it for here. Here’s something you’ll see in boundaries all over the place:
What are those nodes even there for? There are no other features connected here, and it’s (mostly) just a straight line.
This data came from TIGER originally, but TIGER gets it from counties and cities. As someone who is paid to manage this sort of data for a county, I can tell you it has nothing to do with the boundary. It’s about what else is managed with the boundary data.
If the municipal boundary is managed in the same place as things like parcels, you’re probably seeing the nodes where parcel corners are. If the boundary is managed along with 911 dispatch data, you’re probably seeing intersections with roads. Maybe both!
The point, though, is this: those nodes probably don’t need to be there. In fact, if you tracked down the annexation ordinance that established the boundary, those nodes probably are not there at all. The feature probably just snapped to other layers or participated in a topology, and now it’s got all these vertices.
If a node isn’t meaningfully defining the boundary’s shape or connecting it to another boundary, there’s no reason to keep it. Delete!
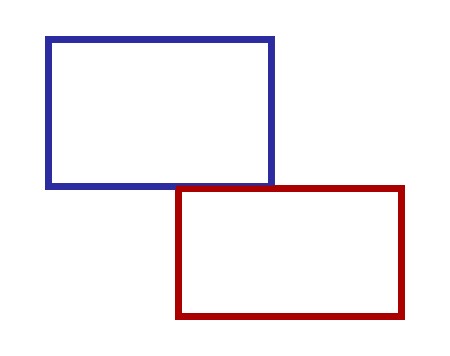
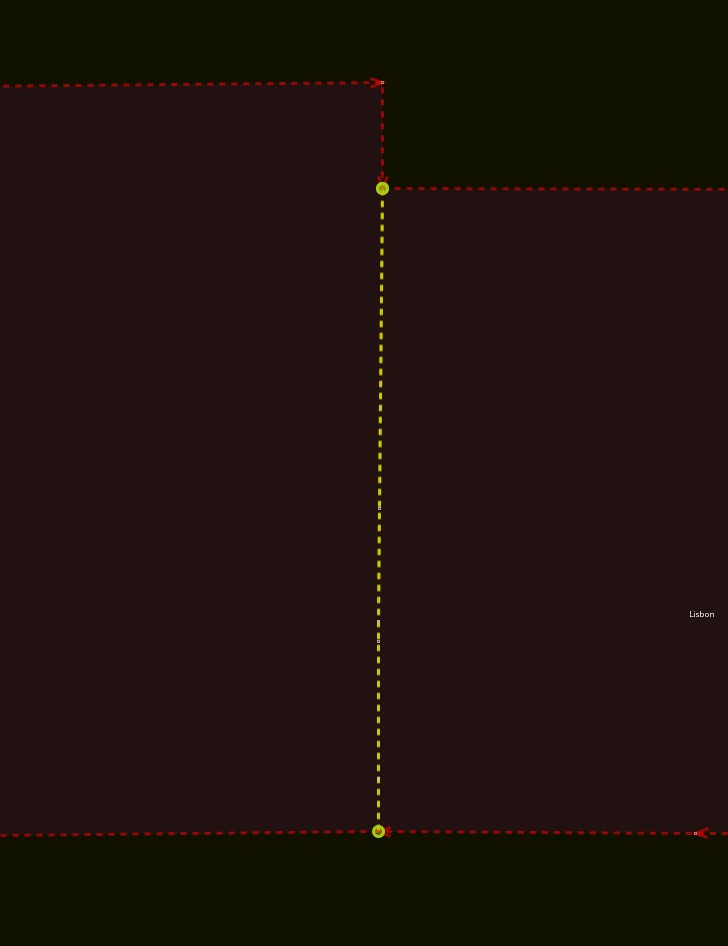
Overlaps that Don’t Share
Let’s revisit that overlap from before:
This is a very simple example, but the steps to address it will be the same even in more complex arrangements.
Before doing any work, make sure that all relations involved are downloaded in their entirety!
- Merge nodes or snap onto the adjacent way such that the boundaries meet at shared nodes
- Split both ways at the two shared nodes
- Select one of the overlapping ways and delete it. Make note of which relation(s) it belonged to!
- Select the remaining way
- Open the relation editor for the relation(s) noted above
- Add the way into that relaion
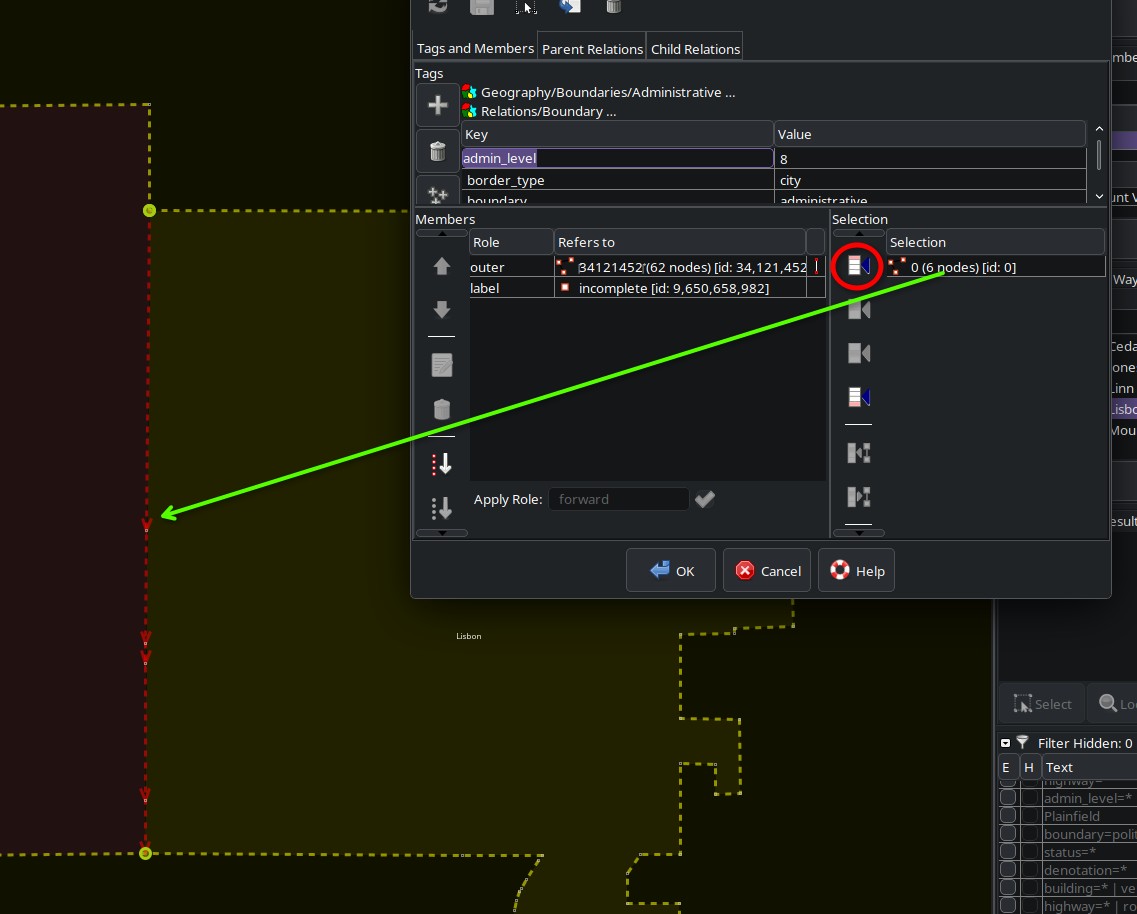
- Apply the appropriate role (
outerorinner) to the way. Sort the relation members as needed to create closed loops.
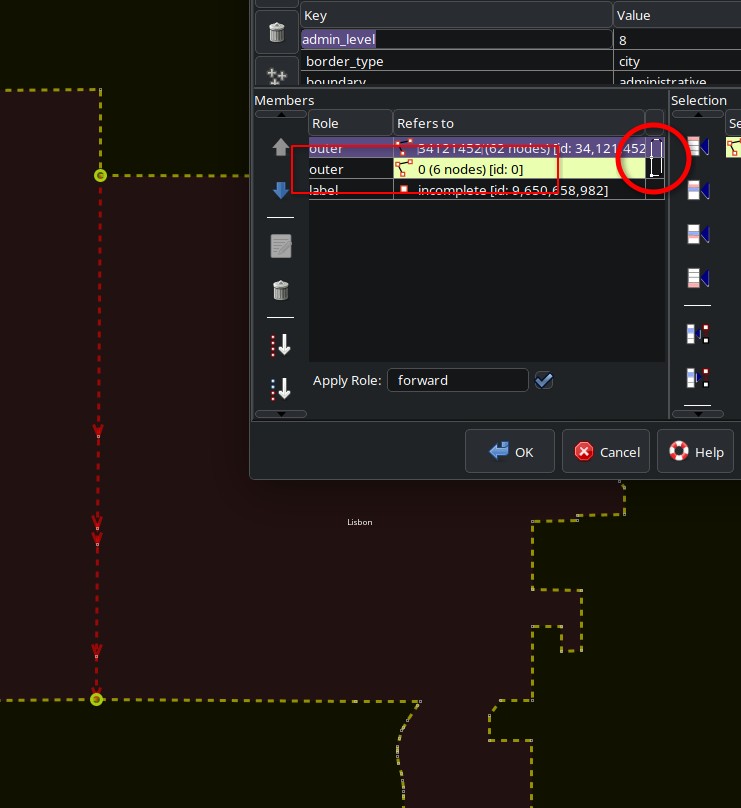
- Check the other relation(s). JOSM should have automatically added the split way into the other relations with the appropriate roles, but it doesn’t hurt to make sure.
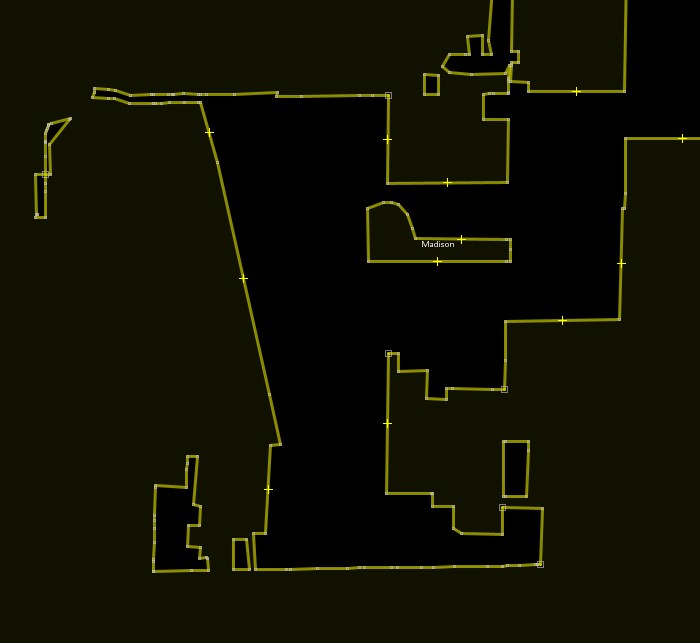
Updating and Adjusting Boundaries
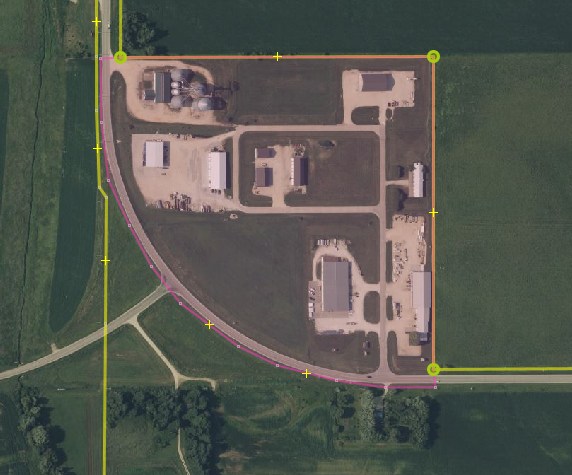
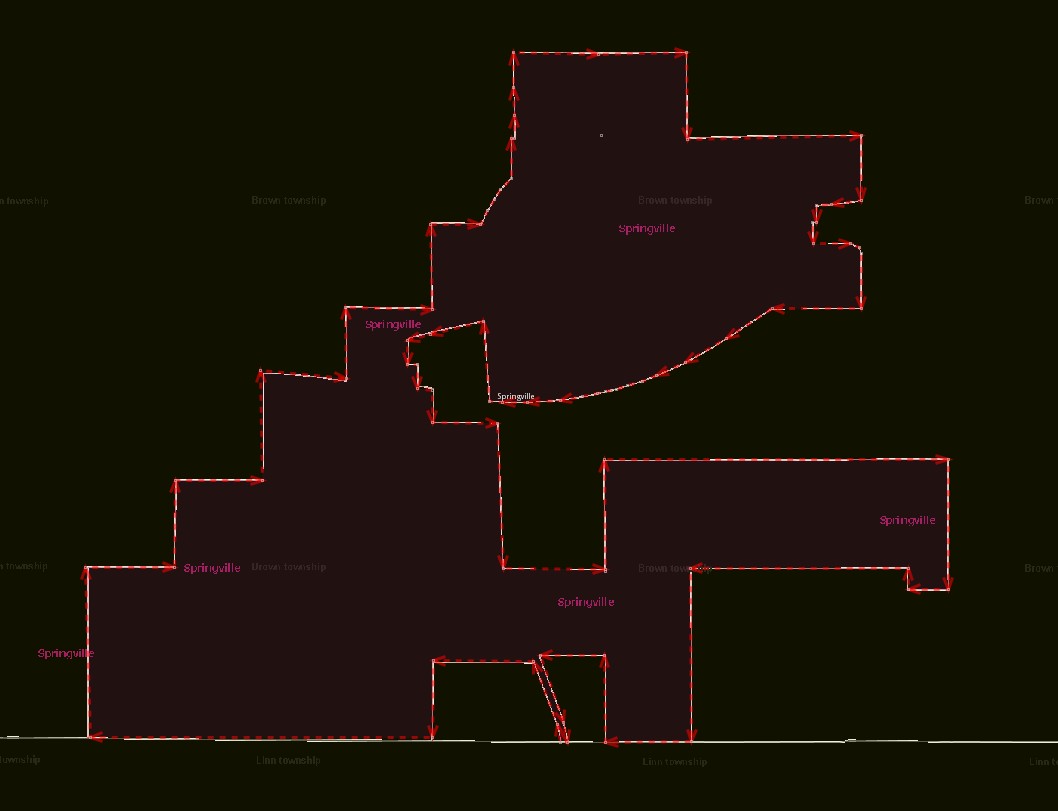
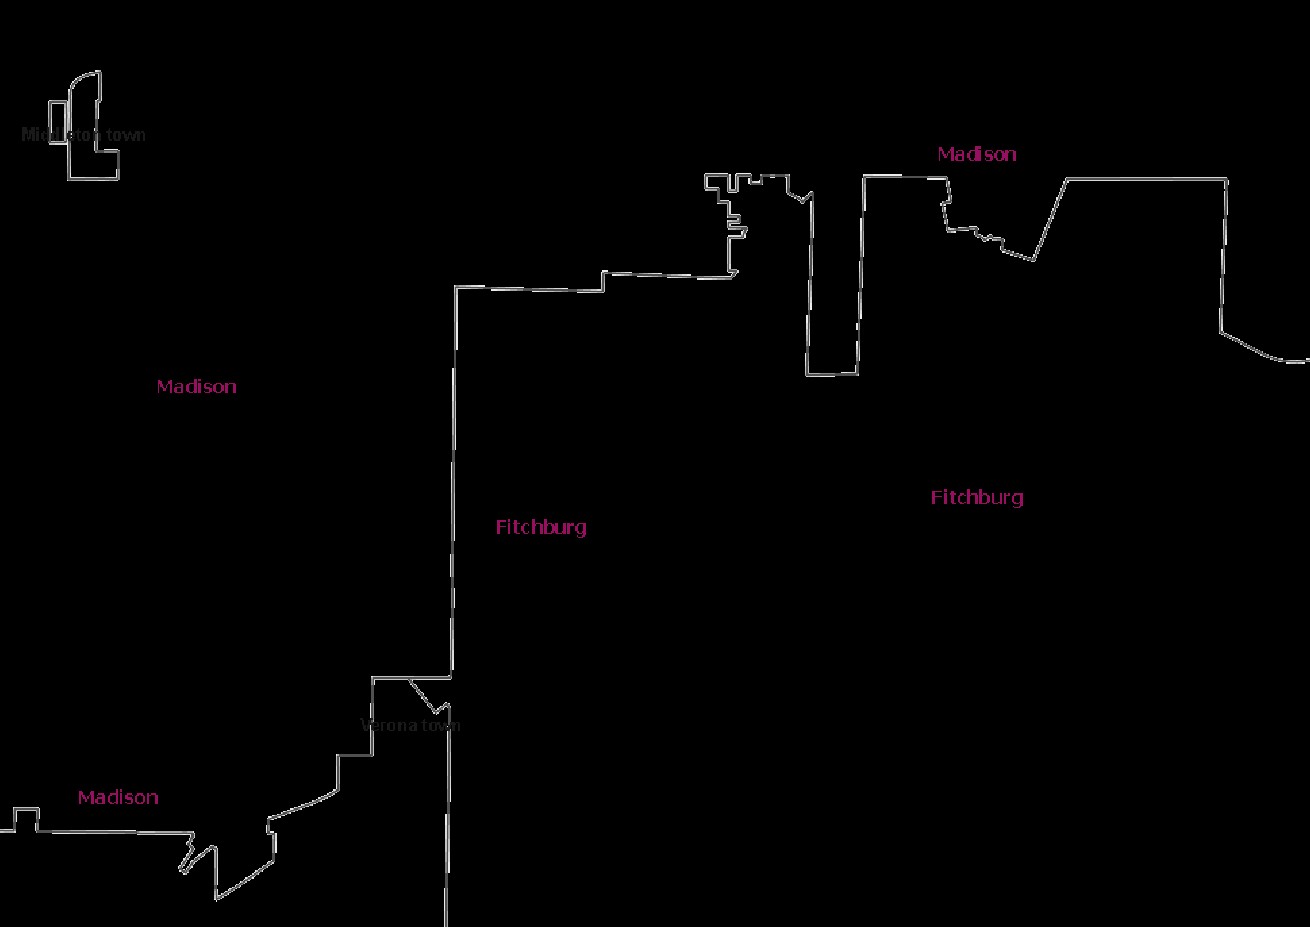
Check out Springville, Iowa:
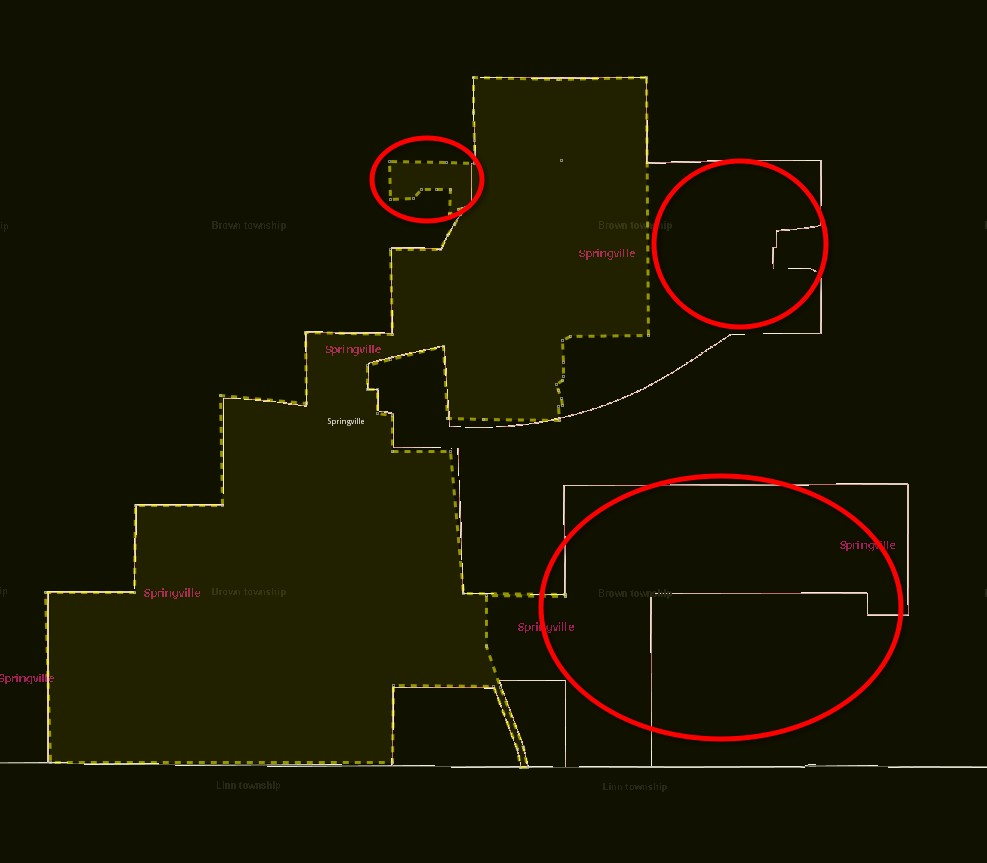
It looks like there are two annexations and possibly a deannexation that aren’t reflected in the OSM data. No adjacent boundaries to worry about, either.
How do I know this? What is that other data?
It’s TIGER data. The next section discusses reference data in more detail. However you identify the changes, if you are confident that these changes need to be made to the OSM data, go ahead and do it!
The Improve Way Accuracy tool (press WW) is particularly helpful here.
This is where cleaning the data really benefits us. If we’ve unglued all the non-admin features, we can safely move these vertices around, even over quite large distances, without worrying about other features being edited by mistake.
Other Data Sources
TIGER Web WMS
The Census has a WMS endpoint, and you can add it to JOSM’s imagery list. There are maybe too many layers in here to use all at once, so we’re going to store the endpoint.
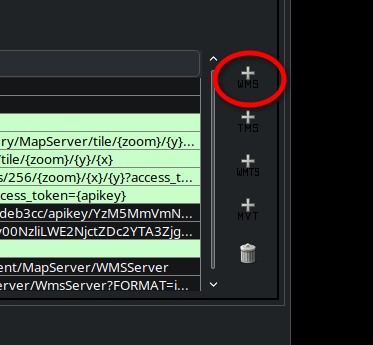
- In your Imagery Preferences, click +WMS to add a new WMS entry
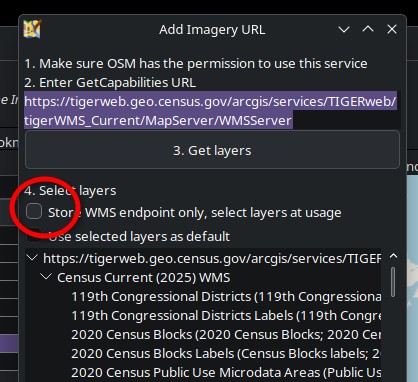
- Paste the URL
https://tigerweb.geo.census.gov/arcgis/services/TIGERweb/tigerWMS_Current/MapServer/WMSServerin the text box and click Get layers - Check the box for Store WMS endpoint only
- Give it a nice name, like TIGER or something
Any time you want, you can add a selection of TIGER layers to your workspace.
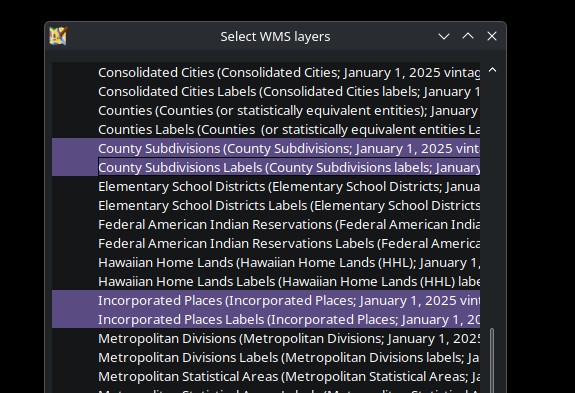
It’s not perfect, but it makes for a great visual reference.
Is TIGER data good?
TIGER ought to be up to date, but it’s up to each administrative body to submit boundary changes to the Census each year. Not everybody gets their submissions in on time, and not all of it is particularly high quality. According to Census staff, some submissions still come in the form of paper maps.
The Census has the thankless job of harmonizing and conflating all of these submissions into one topologically integrated dataset. Given the inputs and the scope, it’s to be expected that the result has its issues.
So, whether the data is good will depend a lot upon the part of the map you’re looking at. A better question to ask:
Is TIGER data from 2025 as good or better than the 2008 data that was originally imported?
The answer to that question is, in my experience, yes. Take a look at the boundary you’re working with, maybe check the relation’s edit history. If it hasn’t been meaningfully updated in years, you’re probably safe to make edits to align it to TIGER.
TIGER Topology in PostGIS
If you look at a bunch of cleaned up boundary relations, the member ways will resemble a topological dataset. It’s a series of distinct shared edges. With a little bit of work, we can use a real topology to help us in mapping out admin boundaries.
If you’ve never played with Topology_Load_Tiger() in PostGIS, it’s a great way to get introduced to topology datasets. The TIGER loading function only works with cities and counties, thought. If we want townships, we have to do it ourselves.
I know, this is not a PostGIS workshop. But I have found this useful in the past, and want to put it out there for anyone who might use it.
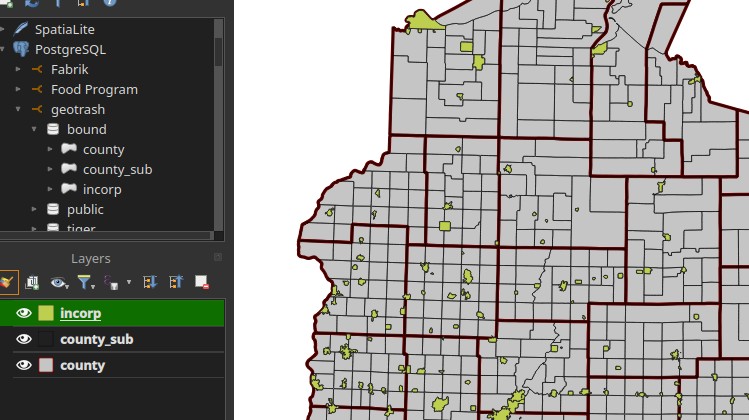
- Get the data, load into PostGIS
You can find GeoPackages of boundaries per state on the Census FTP site.
Docker is good for a quick throwaway project. Drag and drop the layers in QGIS to quickly load them into a database.
- Create your topology, add the new layers to it
SELECT topology.CreateTopology('tiger_topo', 4269, 0.1);

SELECT topology.AddTopoGeometryColumn('tiger_topo', 'public', 'county', 'topo', 'POLYGON');
SELECT topology.AddTopoGeometryColumn('tiger_topo', 'public', 'cosub', 'topo', 'POLYGON');
SELECT topology.AddTopoGeometryColumn('tiger_topo', 'public', 'incorp', 'topo', 'POLYGON');

update county set topo = topology.toTopoGeom(geom, 'tiger_topo', 1, 0.0001);
update cosub  set topo = topology.toTopoGeom(geom, 'tiger_topo', 2, 0.0001);
update incorp set topo = topology.toTopoGeom(geom, 'tiger_topo', 3, 0.0001);
The output will depend a bit on your parameters and whatnot. But generally, you should get something like this in your edges table:
- Export to GeoJSON, load in JOSM
With your proper edges and nodes, you can export to a JOSM-friendly format, load in JOSM, and use it as a reference layer.
I would not use these features as direct imports. However, they can be useful in showing where a complete set of boundary ways is likely to be split based on the adjacent administrative bodies.
This is especially useful when you’re adding new boundaries, such as admin_level=7 features. In states like Illinois, these actually matter, but are often not mapped in OSM.
If I want to add the townships on either side of this small city, I will need to break up the city boundary way
Local GIS: Jumping through Hoops
A County or City GIS is probably going to be the best outside data source, but there’s more legwork involved. You might get lucky, and their data is on some open data site for download. But more often, you’ll need to do some digging.
Lucky you, Joseph Elfelt has already done a log of the digging and compiling sources. Check his list of government ArcGIS Servers first, save yourself some time.
At last check, Wisconsin URLs start at page 449.
If you’re lucky, the county or city you’re working with has a publicly accessible server URL.
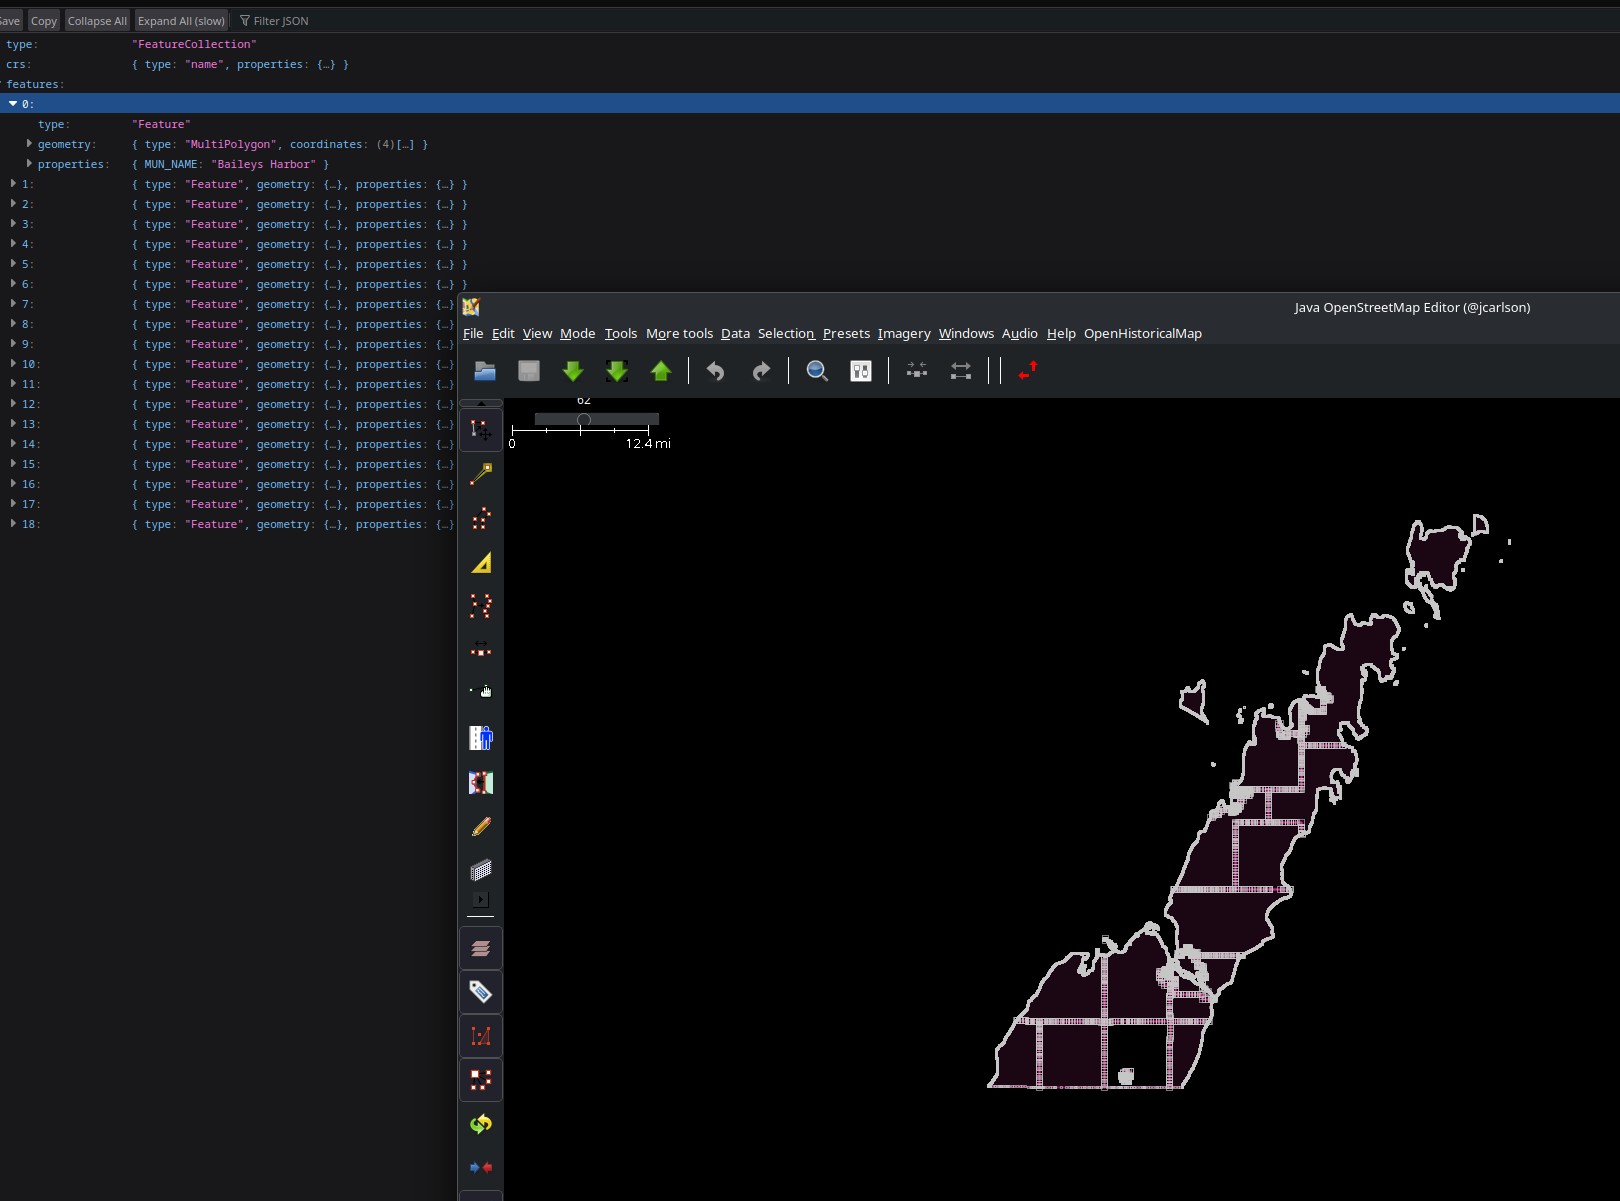
Downloading GeoJSON
Consider Door County’s Municipal Boundaries layer. The /query endpoint is exposed. You don’t need to be an expert on Esri servers, just fill in these parameters:
| param | value |
|---|---|
| Where | 1=1 |
| Out Fields | * |
| Output Spatial Reference | 4326 |
| Format | GeoJSON |
Save the result, load that file in JOSM.
No Query Option?
Some GIS departments don’t make it easy. If you’re handy with QGIS, you can still get what you need.
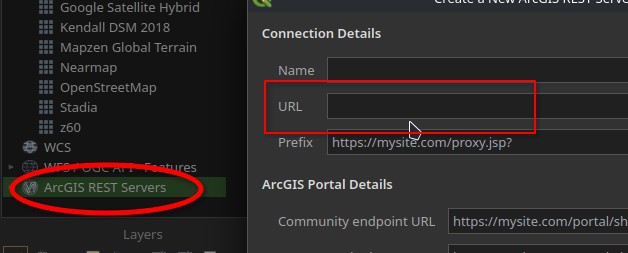
- Add a new ArcGIS REST Server
- Paste the server URL
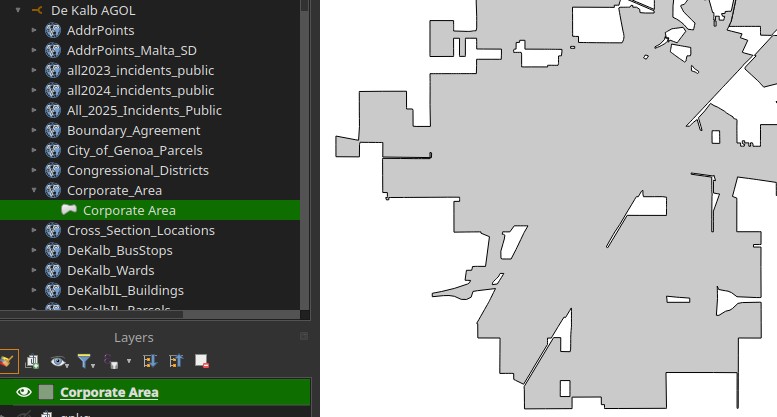
- Browse the layers, add the one you want to your map
- Export the layer to a GeoJSON (be sure to pick EPSG:4326 as the output spatial reference)
When All Else Fails: Eyeballs
Open the city / county GIS map, if they have one. If you’ve got two monitors, put it on one, JOSM on the other. Then just visually compare to spot differences.
That’s pretty much it! Just the ungluing and merging overlaps will probably keep you busy for a while.
Happy mapping!