Intro To QGIS
What is it, and how do you use it?
1 Setting Up
1.1 Installing QGIS
https://qgis.org/resources/installation-guide/
You should have done this before getting to the workshop, honestly. But if you haven’t yet, you can follow the install guide to get situated.
Most of you will probably be on Windows. I personally suggest using the OSGeo4W installer. It makes it easier to update later on, and lets you include other proprietary libraries, such as those needed to work with MRSiD rasters, etc.
Install with Conda
I can’t tell you enough how much I love this option. You need conda or mamba for this, but if you’re already using it to manage Python environments, you’re just a few commands away from installing Q at any version of your choice.
You can just use your terminal to activate the qgis env and run qgis whenever you need it, but that can get tedious.
Instead, browse into your environment manager’s /envs/qgis/bin folder, find qgis, and make a shortcut to it.
1.2 Sample Data
By all means, use your own data for this. Just make sure to have some vector and raster layers to play with.
If you don’t have any, you can find a nice assortment of data at the QGIS-Sample-Data repo, or you can get some nice basemap data from Natural Earth.
We’ll also be connecting to remote data sources later on, so you can pull data from those sources as well.
Now, open up QGIS, and let’s get started!
2 Loading Data
2.1 The Browser Panel
In the upper-left, you’ll find the browser panel. This will give you quick access to any local or remote data sources. Valid layers can be dragged into your map, or double-clicked.
Below the local files are a number of other categories of data sources, like ArcGIS Server connections and XYZ tile basemaps. We’ll come back to these in a minute, just know that they’re in here.
If you have remote drives, like a shared folder on your work network, scanning these locations for changes can slow down the program, particularly when the mapped drive isn’t available, or when your connection isn’t great. You can right-click any letter drive (or even a specific folder) in the Browser panel and tell QGIS to hide / ignore it.
2.2 The Data Source Manager
This window includes the Browser panel, but also gives you a few more options for the kinds of data you add. If your data is on a web server somewhere, or in a database of some kind, it can be helpful. Most data types are recognizable from the browser as well.
2.3 Drop it Straight In
If your files are in a folder, you can drag and drop files from your file program, too, and they should load in the map.
3 Styling Vector Data
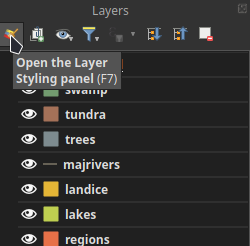
In the lower-left of the interface is the Layers panel. This is where you select an active layer, turn layers on and off, and remove layers from the project, among other things.
One of the buttons will open the Layer Styling panel. Click it!
3.1 Vector Symbol Options
At the top of the panel, you’ll see the layer’s symbology, and a nested list of symbol layers.
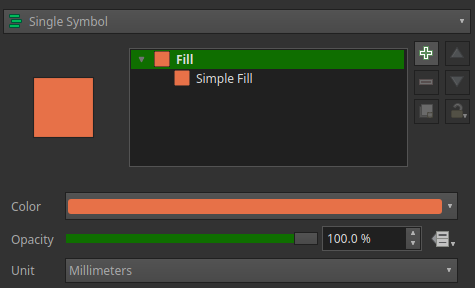
When a layer is first added to your map, it typically has only a single symbol layer, such as the “Simple Fill” shown in the image above.
Click on the symbol layer itself to see options specific to that layer.
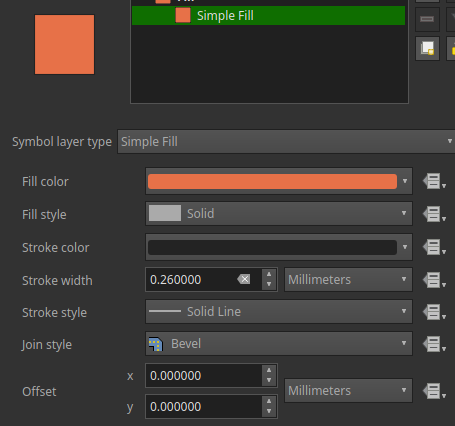
Symbol Layers
The options you see will depend on the kind of symbol layer you’re working with. They should be fairly self-explanatory on the “Simple” layer types. Fill color, outline color, outline width, etc.
Click the symbol layer type dropdown, though, and things get more interesting. Each option has its own settings, which you are encouraged to explore.
Symbol Layer Sub-Layers
When you choose something like “line pattern fill”, notice the structure of the layer list window.
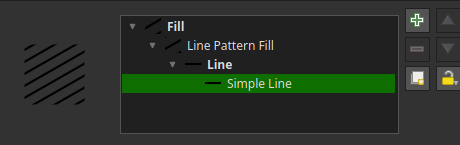
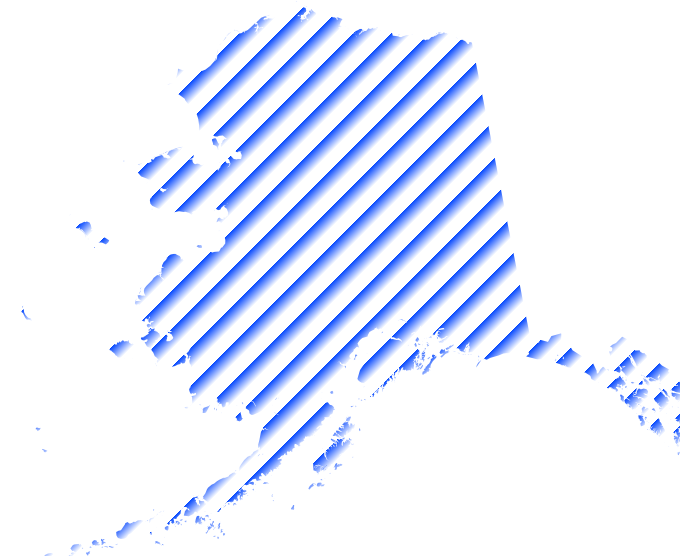
Not only can you adjust the line pattern, but you can change the lines that make up the patterns. You can change the kind of line used in the pattern.
A line pattern of “lineburst” symbols? Why not!
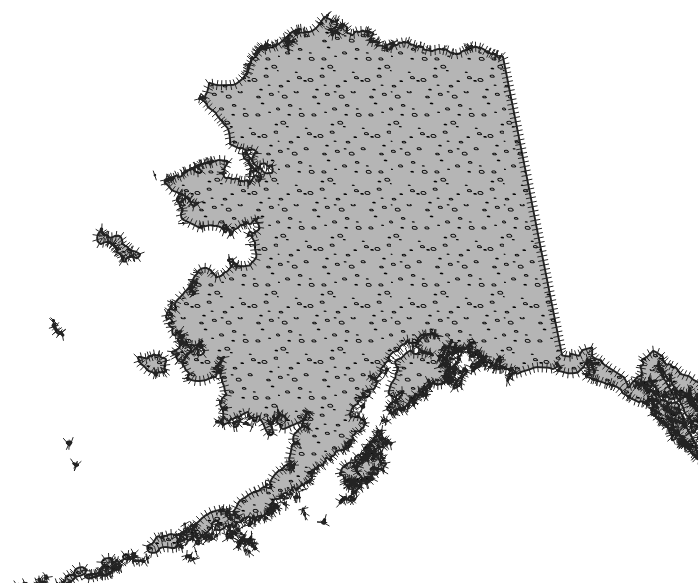
Stacking Layers
Notice the plus symbol next to the symbol layer list. You can add and configure as many symbol layers as you want!
3.2 Vector Symbols by Fields
At the top of the styling panel is a dropdown. By default, it’s at Single Symbol. Often, we want to distinguish the features from one another by some attribute.
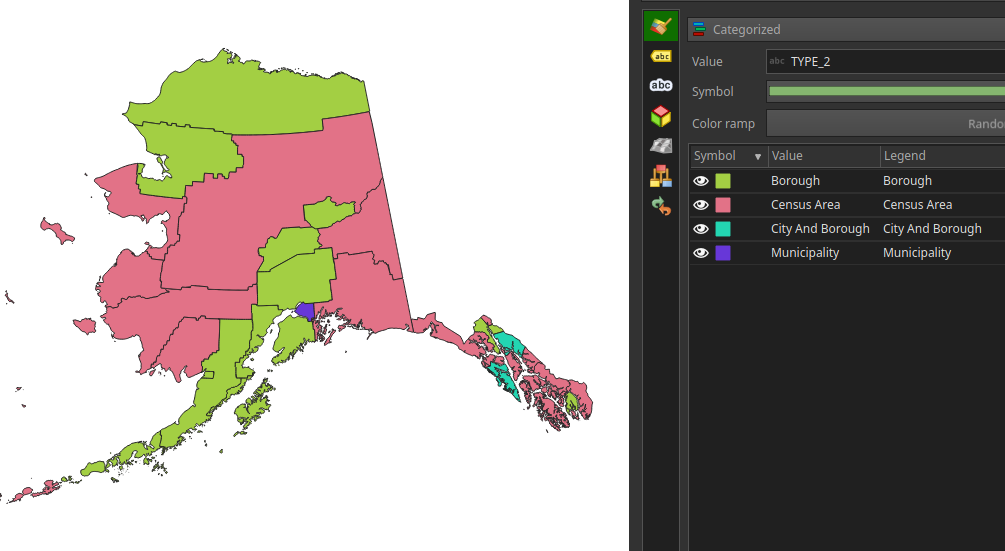
Categorized
Setting the style to Categorized lets you specify a field and define a symbol for each unique value in that field. Click “Classify” down below to generate classes based on the layer values.
Once you have your list, simply double-click any category to edit its symbol specifically.
Graduated
For quantitative data. Depending on your feature type (point, line, polygon), you have options of changing the color or the size of the symbol.
In this symbol style, you can choose how many classes to separate your features into, as well as how class breaks are determined.
Whenever you work with quantitative data, rest assured that there are a lot of best practices and conventions around how to clearly and fairly show that information cartographically. Whole books on the subject!
Rule Based Symbols
Rule based symbology is extremely powerful. Where categorized symbols have to follow the same field, rule-based symbols can all be different, and even overlap.
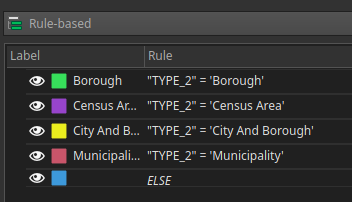
To get an idea of how rule-based symbols work, set your layer symbology to Categorized and set up some categories, then switch to rule-based. Your categories will have carried over as rules!
You can see there that each rule is represented by an expression. In the pictured example, the rules are simply checking a single field against specific values.
But what if I add a rule that overlaps?
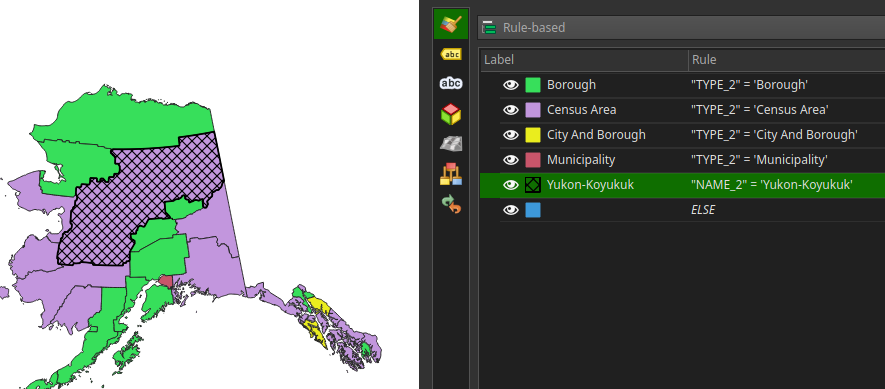
As long as my symbols are visually compatible, we get both!
Worth noting: rules also have the option of being scale-based. So you could have multiple versions of a rule that kick in at different zoom scales.
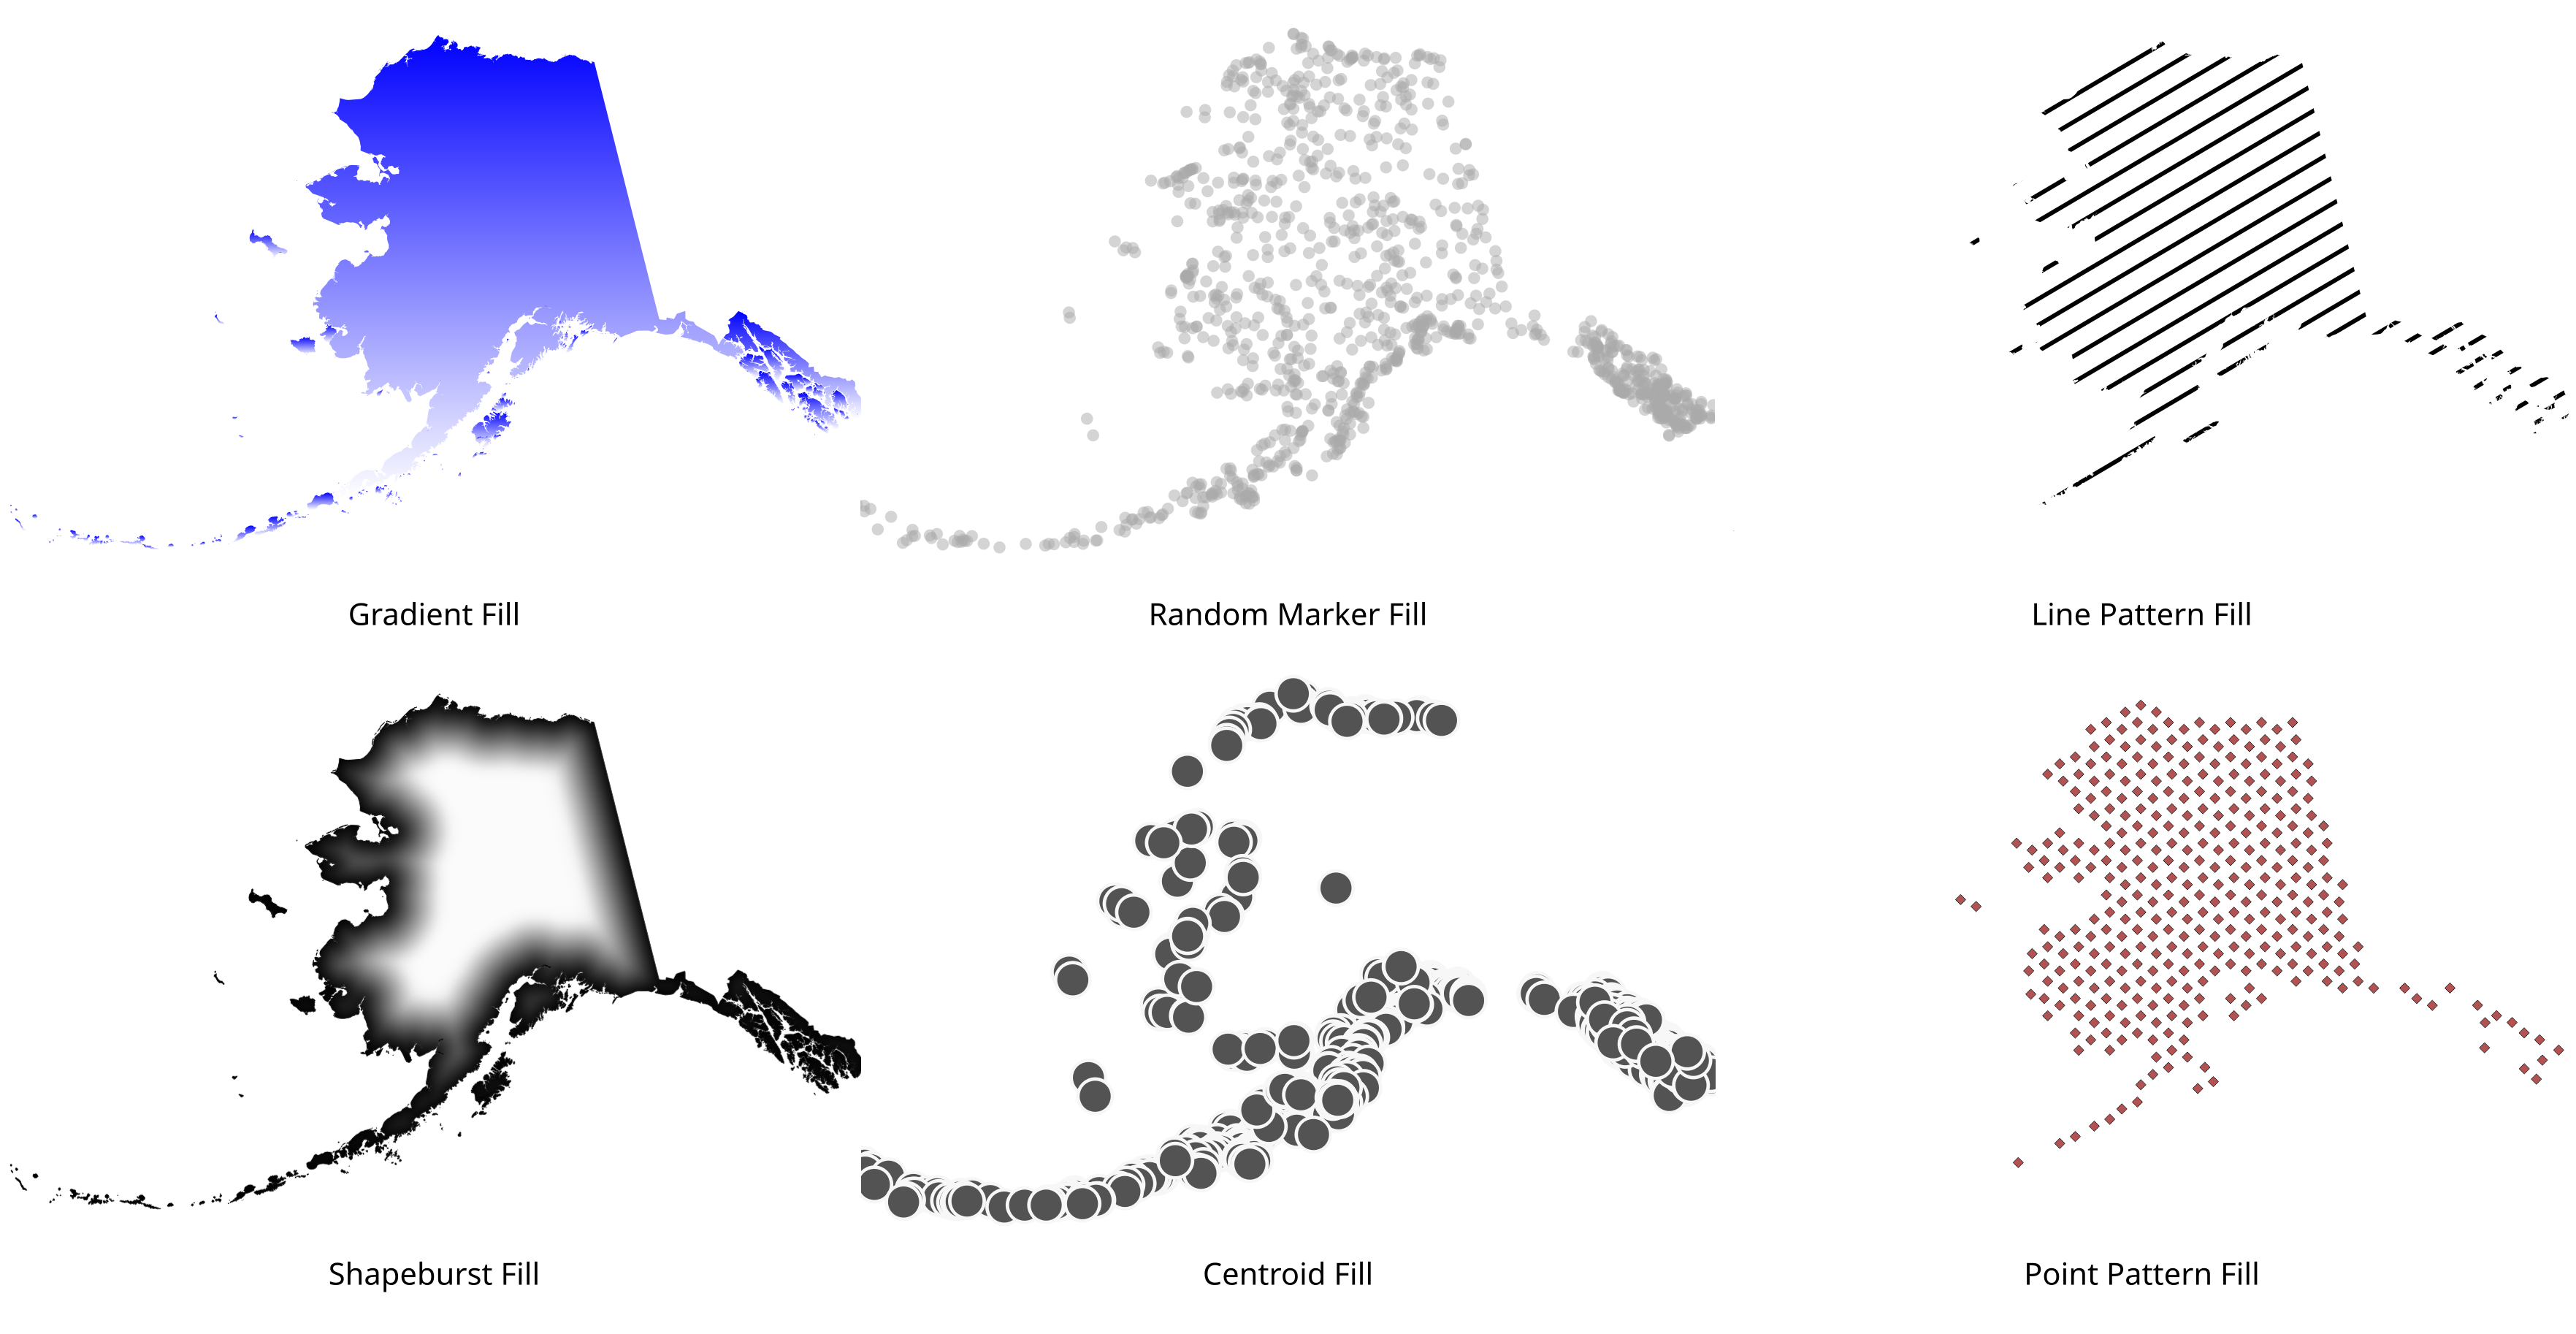
3.3 Other Symbol Modes
There are a number of other symbology types available to you that are super cool. Too many to go into much detail on, and it’s better to just play with the data and figure it out anyway.
3.4 Styles & Themes
Styles
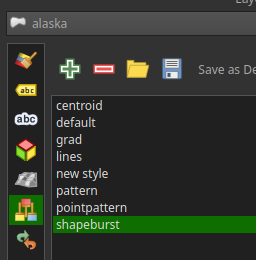
On any given layer, you can manage a series of styles. Think of these like symbology “bookmarks”. If you have a symbology style that you like, or which is useful for some purpose, add a new style for it.
Each style can be separately activated and configured.
Themes
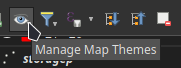
Themes are to your layer list what styles are to individual layers. In your Layers panel, click on the eyeball button to open the Theme menu.
Adding a theme will save the current state of which layers are on and off, as well as the currently active style for each layer.
Combining themes and styles together make it possible to generate entire series of maps from just a few layers. We’ll see an application of those later, when we work with print layouts.
4 Labeling Vector Layers
Still in the Layer Styling panel, with a vector layer active, click the next tab down in the left-hand list. Click the dropdown and set it to Single Labels.
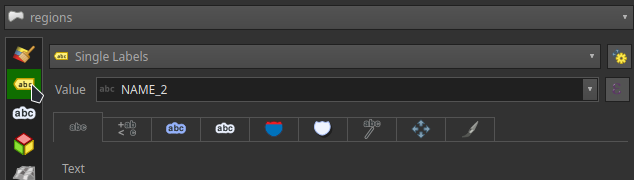
Q will always look for a field like “name” and guess that for the label value, but you can choose another field if you need.
The sub-tabs of the label style are pretty self-explanatory, and you can click through them to adjust things like line breaking, abbreviations, halos, and backgrounds, just to name a few.
4.1 Rule Based Labels
Just like our symbology, labels can also be rule-based. This is great when a single layer has different types of features that may be more or less prominent, such as a roads layer. Interstates? You want to label the number with a shield around it. Tiny residential roads? Small text, and a scale limit.
5 Styling Raster Data
Rasters, like vector data, come in all sorts of different styles. If you’re interested in working with multiband raster data, that’s a bit beyond the scope of this workshop.
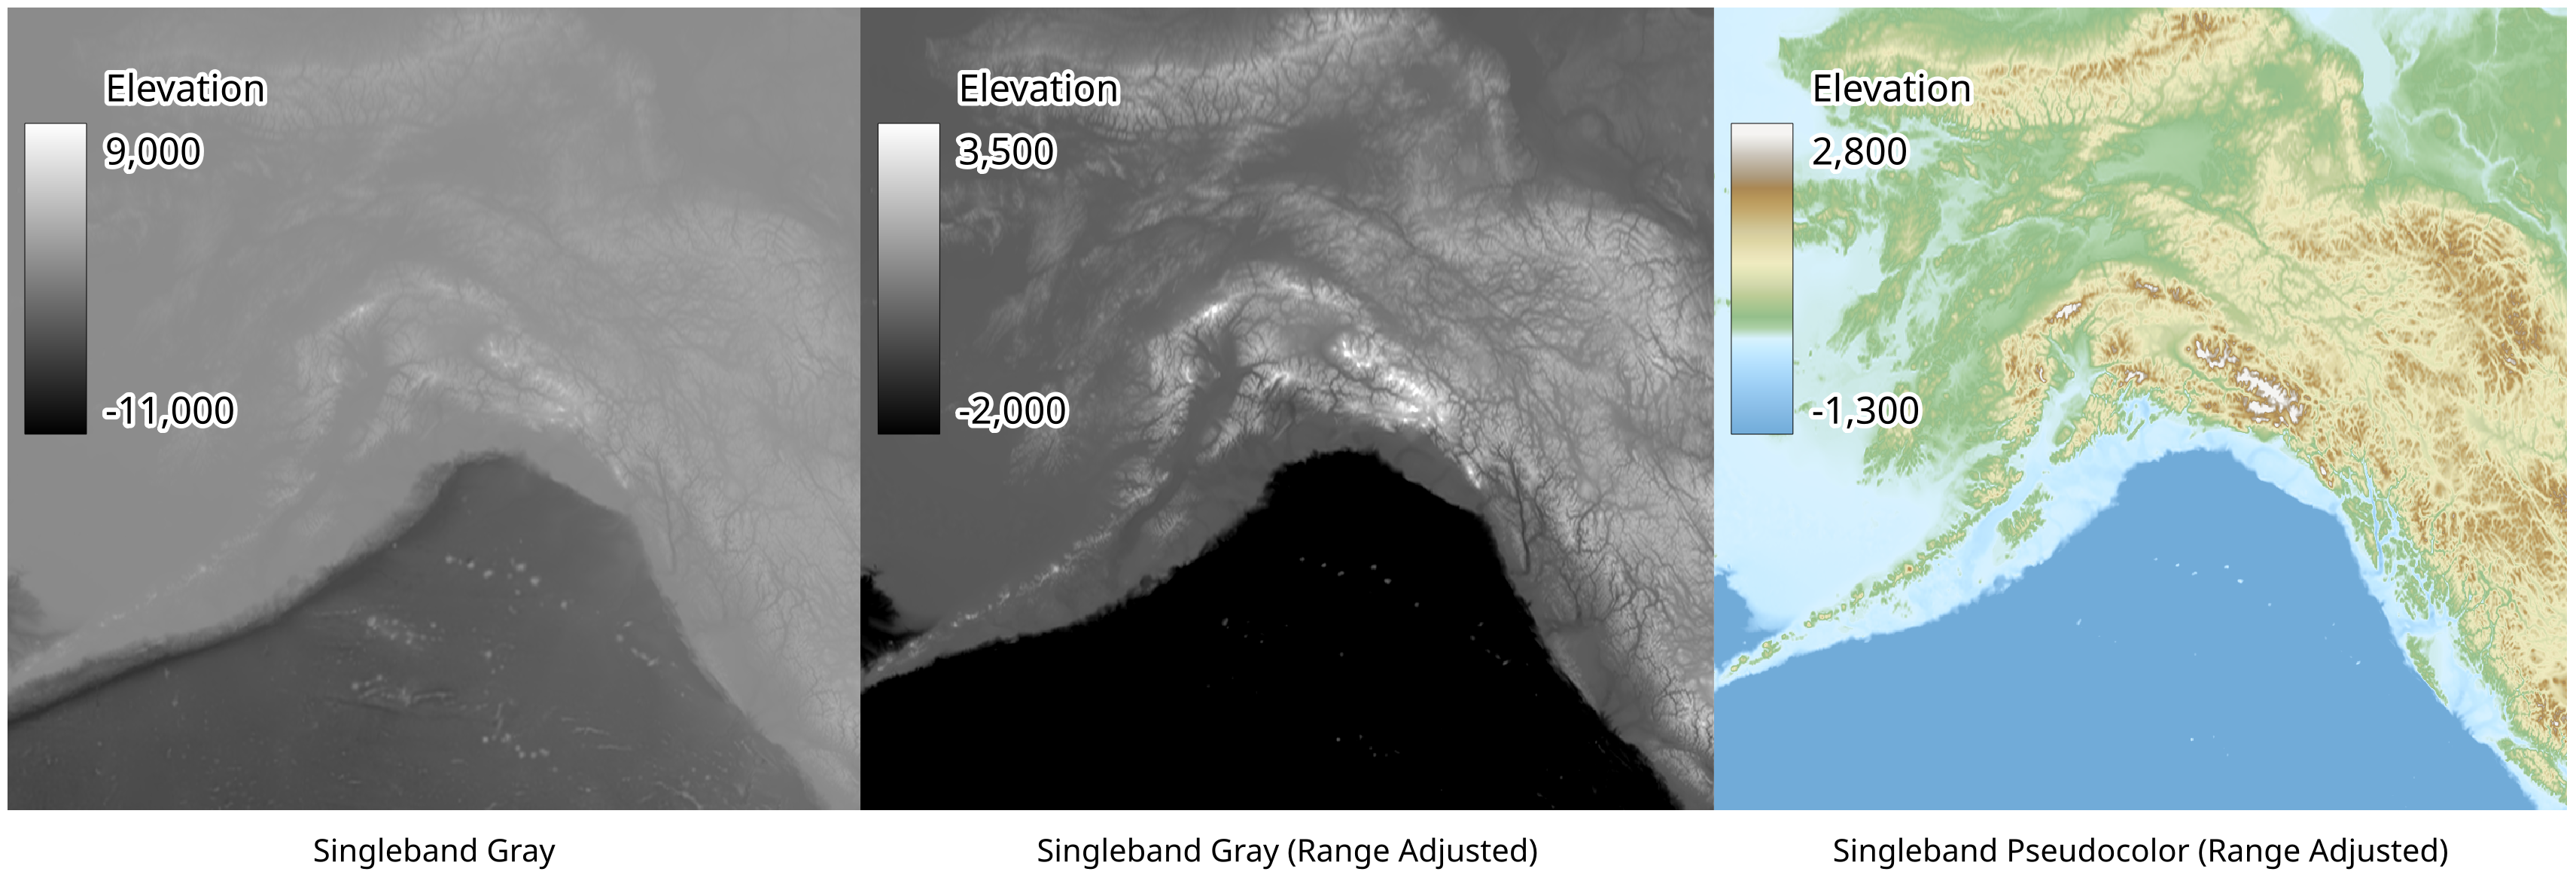
We’re concerned with singleband, continuous raster datasets. When you add a singleband raster to your map, it comes in as a standard gray.
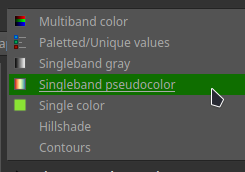
You can adjust the data range to emphasize features or areas you’re interested in, but gray is boring! Switch to “singleband pseudocolor” to get a more interesting color ramp.
5.1 DEMs
One of the most common raster types is a Digital Elevation Model (DEM). QGIS actually has a few built-in raster styles specific to these.
The QGIS Sample Data doesn’t come with a DEM. If you don’t have one handy, go to the Browser panel, scroll down to the XYZ Tiles section, and look for Mapzen Global Terrain.
You may need to set your map projection to EPSG:3857 to get the layer to display quickly, otherwise you’ll wait for the data to get warped and redisplayed.
What do people do with most DEMs, anyway? Hillshades and countour lines. Now you can get your nice cartographic layers from your DEM on the fly.
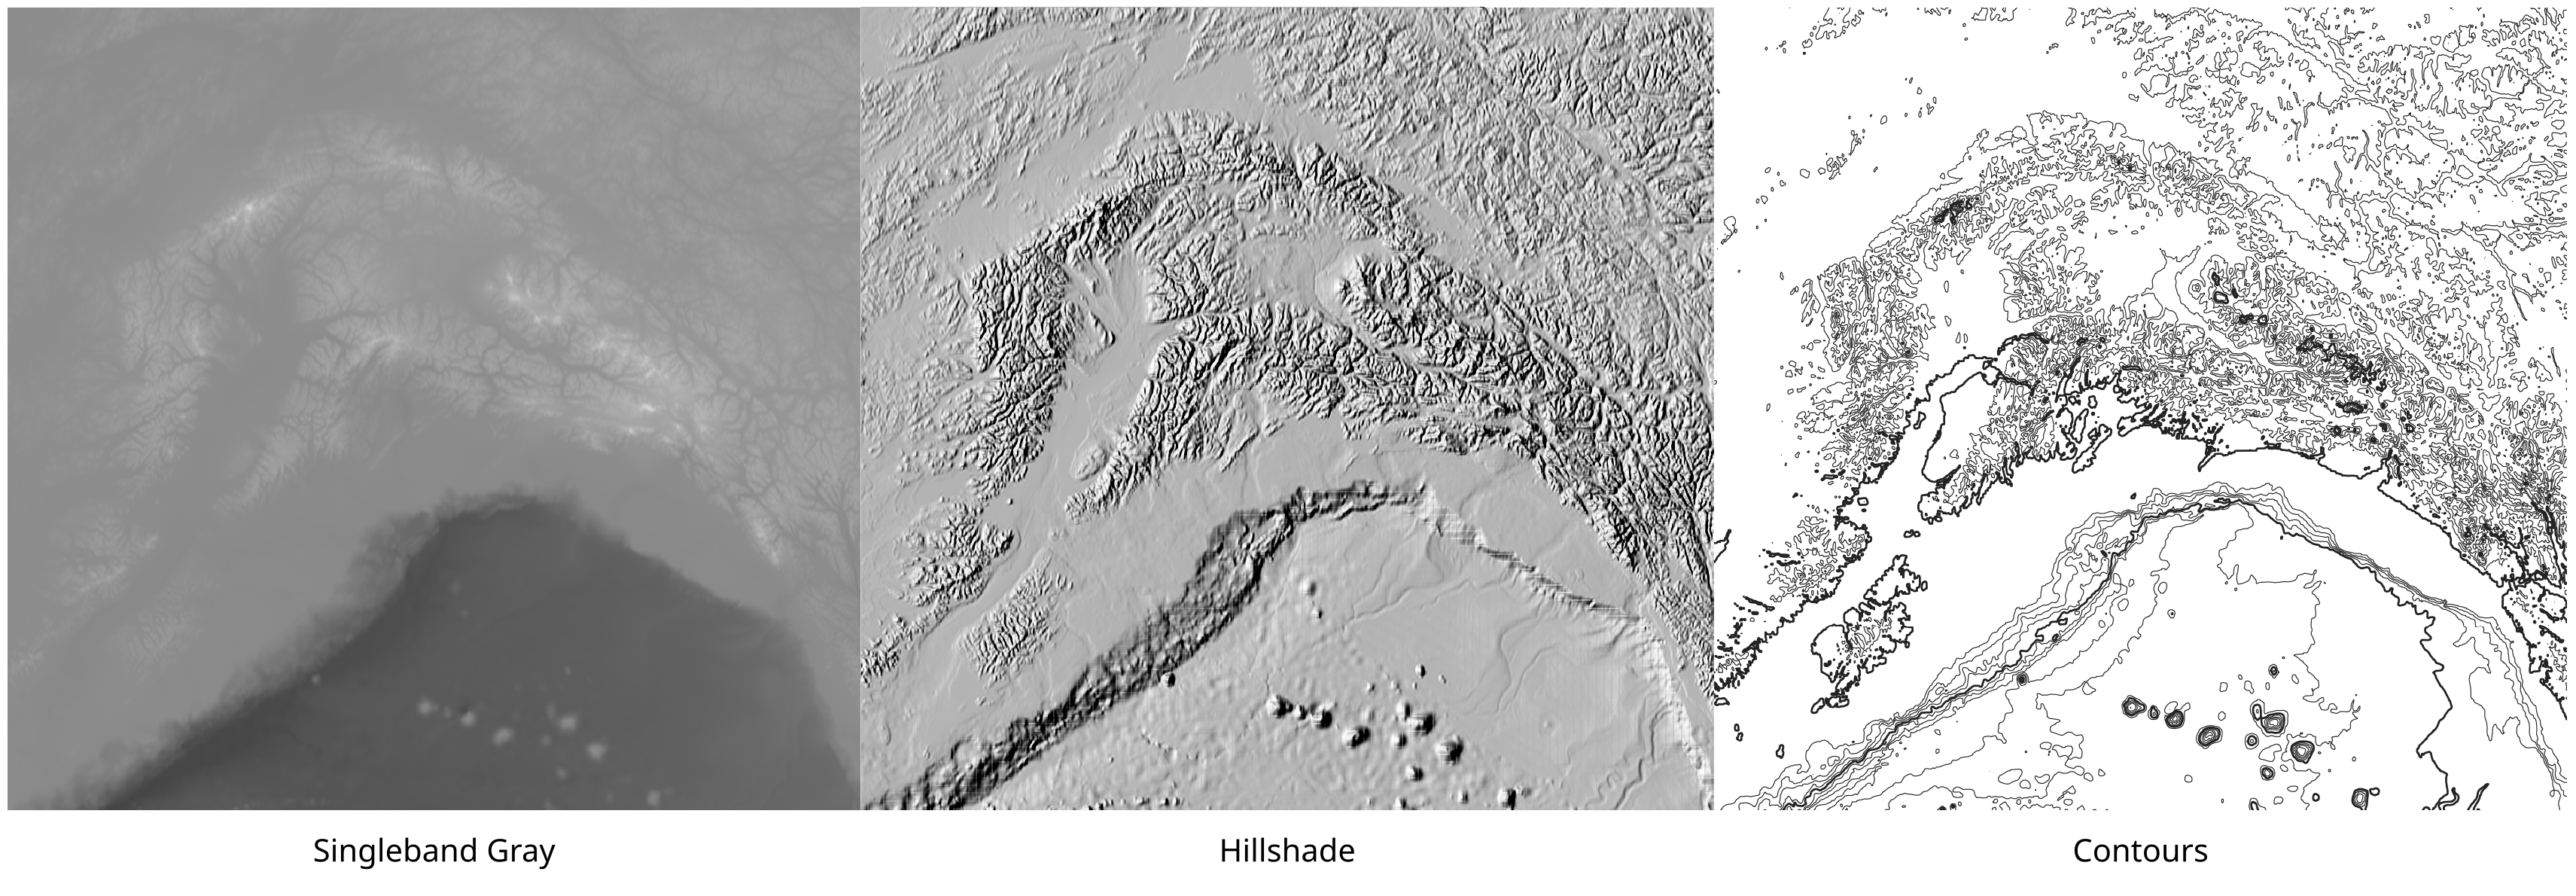
They won’t be quite as accurate as a layer generated using a processing tool, but for a quick visualization, it’s pretty darn neat.
6 Processing Toolbox
Look for the gear icon in your toolbar, or else use the keyboard shortcut Ctrl + Alt + T to open the Processing Toolbox.
This panel has all the different tools you could want. This is also where you access Q’s Model Designer.
The most important part: there’s a search bar at the top! You may not know which folder has the tool you want, but you can search “clip” and see a short list of matches.
There are, honestly, too many tools to even begin discussing for an “intro” workshop. Knowing where the toolbox is and how to find tools in it is enough for now.
7 Print Layouts

In the toolbar, look for the “New Print Layout” and/or the “Layout Manager” button. The former gets straight to a new layout, whereas the latter opens a small window to view and manage all existing layouts already in your project, as well as create new ones.
7.1 Layout Tools
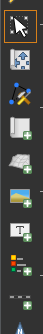
All the tools you’ll need for your print layout are on the left toolbar.
The page with the curled edge and the “+” is the “new map” button. Use that to add one or more maps to your page.
Most of the other buttons should be pretty clear what they’re for: adding images, text, legends, etc.
7.2 Item Properties
With a layout item selected, the Item Properties panel on the right will show all the settings available to configure for that specific item.
7.3 Maps
When you have a map item active, there’s a toolbar button for Move Item Content. Use this to pan and zoom the map itself, without affecting the layout’s map frame.
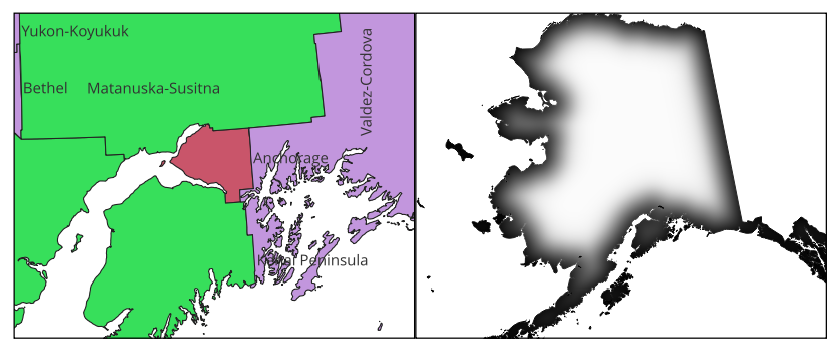
Follow a Theme
If you created a theme earlier, now it comes into play. You can configure your map to follow a specific theme, regardless of what’s showing on the main map canvas.
A common use for this is for locator maps. You may have a separate style and theme to show a basic locator, without all the clutter and detail that you want on your primary map.
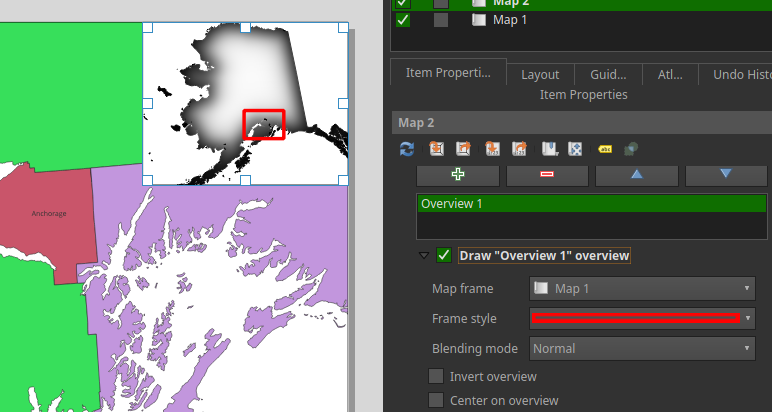
Overviews
Adding an overview to a map lets you symbolize the extent of some other map in your layout. You can adjust how the overview looks, and which map frame it references.
7.4 Legends
There’s a lot you can configure on a legend, but there are two settings in particular that help a lot. They’re in the section Legend Items.
The first is the checkbox to only show items inside linked maps, which does exactly what it says. If you have other layers that are hidden, turned off, or have symbol categories out-of-frame, this option removes those items from the legend.
The second is the checkbox that says auto update. This will “unfreeze” the legend and allow you to manually add, remove, and edit legend items individually. If you need to really fine-tune your legend, this is the way to do it.
8 Editing Vector Data
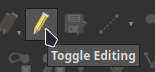
QGIS is also an excellent program for modifying your data. For layers that allow editing, with the layer selected in the Layers panel, the “pencil” icon will become enabled up in the Editing Toolbar.
8.1 Additional Toolbars
By default, the editing toolbar is pretty limited. You can add new features, edit vertices, copy, past, and delete.
Right-click the toolbar area, or select Settings → Toolbars, and you can turn different toolbars on and off.
I suggest adding the following toolbars, if they’re not already on:
- Snapping
- Advanced Digitizing
This will give you access to the tools you need for more advanced editing workflows.
Snapping: More than You Think
Snapping isn’t just about getting vertices to line up. On the right side of the snapping toolbar, there are some other things you can turn on.

The first two on the left of that image are particularly useful:
- Topological Editing: editing the vertices of one feature will automatically update features which share those same vertices
- Overlaps: turning on “avoid overlaps” ensures that the edges of polygons you add or edit do not cross edges of other existing features
You can also turn on “advanced configuration” to change the snapping settings for every layer individually.
8.2 Sketching Shapes
With an editing / digitizing tool active, left-click on the canvas to start a sketch. Whether you’re drawing a split/reshape line, or you’re drawing a brand new shape, your sketch will be shown as a red line/area. As you move your cursor, a dotted red line shows the current segment of your line.
- Left click to add vertices
- Right click to finish the feature
- Backspace to undo a vertex
-
- If you don’t have a layer you can edit, click the little “microchip” in the toolbar. This adds a temporary scratch layer to your map.
-
9 Tips and Tricks
That’s really it for the basics on how to get around QGIS. But here are a few things I felt worth mentioning.
9.1 Preview Modes
In the top toolbar, chose View → Preview Mode. You can preview your map in a series of different styles to ensure accessibility.
9.2 Shortcuts in the Browser Panel
Project Home
When you save a project, whatever folder the project file is in becomes a green “Project Home” folder in your browser. This can be a nice way to keep all the project-specific data and other resources (icon SVGs, images, etc) close at hand, without needing to sift through your file browser.
Favorites
For local files and folders, you can right-click any folder and mark it as a Favorite. This puts a shortcut to the folder at the very top of your Browser panel. If you like to keep all your GIS data in one spot, it’s a good idea to add it to your favorites.
Favorites carry over between projects, too!
9.3 Edit Features In-Place
In the Processing panel, there’s a button to turn on Edit Features In-Place. When active:
- The number of geoprocessing tools available is limited
- Any tool you run will directly edit the layer (or the features you have selected)
9.4 Working with File Geodatabases
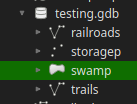
Yes, you heard me! QGIS works with Esri File GeoDatabases for reading and writing. You can open a FGDB from the browser panel like anything else. QGIS automatically detects when a folder ends in .gdb and displays it instead as a database of nested layers.
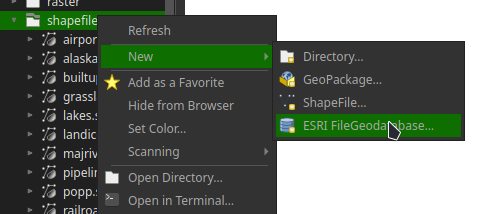
It’s not just existing FGDBs, either. You can also right-click a folder and choose New → ESRI File GeoDatabase.
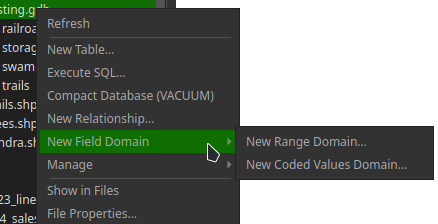
Working with FGDBs is not just limited to opening and editing layers. You can right-click the .gdb and perform other tasks, like managing domains, relationship classes, and compacting the file.
9.5 The Search Bar
Ctrl + K activates the search bar. You can search for just about anything, but by typing a number of special characters (and then a space), you can change what the search bar does. My favorites:
- Putting a > before your search will query OpenStreetMap’s locator service, great for zooming to named places and addresses.
- l searches through the features of your active layer, on any of its fields!
- . will search Q’s actions, which includes lots of toolbar buttons, menu items, and, notably geoprocessing algorithms. If you know the name of the tool you need, this can be a lot faster than opening and browsing the processing toolbox!
10 Resources
10.1 Further Training
Check out these links for lots of in-depth lessons that you can work through at your own pace.
- QGIS Training Manual
- QGIS Tutorials
- Search “QGIS Tutorial” on YouTube
10.2 Connect with the Community
The QGIS-US User Group, which has a dedicated discussion space on the OSGeo forums.
Bonus: Easter Eggs
Try typing these words in the coordinate box at the bottom of the map canvas:
- world
- retro
- contributors
- hackfest
- bored
- dizzy